
“Tokyo now holds $ 1.1 trillion, to China’s $ 870 billion (in US Treasury bonds), and that heavy exposure means both countries are vulnerable to a potential crash in the value of US Treasuries. The falling value of Treasuries would lead to a drop in Japan’s and China’s foreign reserves. That means they would have less money available for essential imports, service their own foreign debts, or prop up their currencies. “
(Josh Lipsky & Philip Meng, Atlantic Council’s GeoEconomics Center, 2023)
“International governance should be based on the rules and consensus reached among all countries, not on the order given by one or the few.”
(Xi Jinping, 2021)
“A dramatic unwinding of that relationship (between US and China), by way of an aggressive trade policy, is one of the nightmare scenarios for the global economy as a whole, because it would result in spiraling depreciation of the dollar, a surge in American interest rates, a collapse in the market for American government debt.”
(Judy Woodruff, PBS NewsHour, 2016)
“Do you understand the sadness of geography?”
(Michael Ondaatje, The English Patient, 1992)
“Ici repose un géant endormi, laissez le dormir, car quand la Chine se réveillera, la terre tremblera.”
(Napoleon Bonaparte, St Helena, 1815-1821)
“Despite rising geopolitical tensions, the United States remains China’s single largest trading partner. It is also the second largest for Japan. In 2022, USChina trade hit a record high of $ 691 billion. As the US economy slowed, the impact would be transmitted through trade, depressing China’s exports to the US for example, and contributing to a global slowdown.”
(Marcus Noland, Peterson Institute for International Economics, 2023)
“The control of information is something the elite always does, particularly despotic governments. Information, knowledge is power. If you can control information, you can control people.”
(Tom Clancy, interviewed by Sara Schafer, 1995)
“Nobody learns the lessons of history. Even if you know history, which most don’t, we don’t learn the lessons of history. But they’ve always lead to trade wars. And trade wars have often led to the real thing.”
(Jim Rogers, Business Insider, 2016)
“No tree, it is said, can grow to heaven unless the roots reach down to hell.”
(Carl Gustav Jung, Aion, 1951)
Things are getting interesting fast. On 29th May 2023, CNN Hong Kong announced that Wuhan, the largest city in Central China, had publicly demanded that 259 local companies repay their debts, in a rare move that highlighted the dire financial situation facing China’s municipal governments. The debtors and guarantors included state and privately owned companies, government departments, and think tanks, according to official media outlets. The Wuhan Municipal Bureau of Finance said it had been unsuccessful in collecting the debts and offered rewards to anyone able to provide useful information about the debtors’ financial assets. It also publicly named hundreds of the debtors in a local newspaper article.
Wuhan’s announcement came days after the official financing bureau of Kunming, capital of the Yunnan province, one of the most indebted provinces of China, struggled to raise money to pay debts owed to their bondholders. The outstanding debt/fiscal income ratio of the province exceeded 1,000 per cent in 2022. The Chinese province Guizhou in April 2023 publicly admitted defeat in trying to organize its finances, appealing to Beijing for assistance to avoid default.
Runaway Debt
How much debt hurts an economy? And how much debt counts as too much? What happens when debt is no longer effectively self-liquidating, when debt rises faster than the real debt-servicing capacity of the economy. When debt becomes astronomical. Governments have grown the habit of evading the question altogether. Central banks have tried to push a real economic recovery with monetary policies, the ripple effects of which will unfold for years to come. They paved the way for “everything bubbles” in the words of Daniel Acker. Investors felt encouraged to pursue risky investments and untenable businesses. If central banks do not raise policy interest rates, inflation may further accelerate. If they do intervene, other things break. It is difficult to predict how the current debt cycle, which started in the 1945 post-war period, will move forward, slow and incremental, or violent and severe. But move it will. Market trends we are familiar with can be swept away, and become irrelevant in a downturn. Decades of wealth creation can shift to wealth distribution. There will have to be massive debt relief to avoid chaos.
Doom and gloom analysts used to sound like a broken record. Maybe no longer. Contrarian opinions are en vogue. After an era of low interest rates, the world is acknowledging it is awash in debt – issued by households, corporations, and, mostly, governments. Global debt reached nearly $305tn, or 349 per cent of global GDP, in 2022. This exponential high debt level represents a rise of 30 per cent in the global debt-to-GDP ratio in the past 5 years. There is no easy way to cut through it.
Runaway debt is the preeminent risk to global financial and political stability in our time, followed by fragmentation and climate change. Many have trouble to understand the implications of debt. Most economists measure the burden of debt of a country by its national debt-to-GDP ratio, ignoring the vast differences in debt that exist. Different kinds of debt have, however, different consequences, and between countries the costs of servicing rising debt vary signficantly. There is a persistent belief that no spending limits exist for a government that creates its own fiat currency, and that such a government can spend an unlimited amount without concern, until there is a surge in inflation. We have to ask ourselves: fact or myth? While it is true that a government can create money or debt to fund its spending policies before it has obtained funding, is not true that there are no limits. Debt becomes a problem when it rises faster than a country’s real debt-servicing capacity. An economy cannot consume and invest more than it produces and imports, and government spending that increases demand without increasing supply by the same amount, creates an imbalance in ex ante supply and demand, which must be restored. This transfer mechanism can distort the economy in ways that undermine growth and stability. When debt levels rise exponentially, governments will resort to adjustment, and certain sectors and groups will lose their purchasing power, as the cost of restoring the equilibrium between demand and supply, the cost of the debt burden, is transferred to them. These transfers trigger financial distress behavior, create fictitious wealth, and harm future growth when the trend eventually reverses.
Interest groups recognize the risks, and are usually quick to change their behavior and protect themselves from absorbing the costs. Examples abound. A recent case are The Netherlands, where livestock farmers are at risk from being shut down or expropriated (sic), as an outcome of Dutch climate change policies. According to Statistics Netherlands (CBS), the number of livestock farms halved to 45,816 between 2000 and 2022 (the average size per farm increased from 5.7ha to 32.4ha). By 2040 only 25,000 livestock farms will remain in operation (compared to 410,000 in 1950). The Dutch government considers the closing of the farms an “incidental cost”, a lesser evil compared to the greater good of its carbon emissions policy, something that has a transitional inflationary effect in itself. The farmers beg to differ. They have taken their discontent onto the streets, riots, road blockades, flags, and fire torches included, and have cut off negotiations with the Dutch government. The farmers are supported by a surprisingly large cohort of silent voters. Recent provincial elections in The Netherlands resulted in a new farmers’ protest party, the agrarian and populist Farmer-Citizen Movement (BBB), to win an outright 24 per cent majority of electoral votes, becoming the largest Dutch political party overnight. Interestingly, a large number of these votes originate from urban voters in Dutch cities and towns (if all farmers of the country would have voted BBB, this would have accumulated into no more than 106,000 votes). A “summer of discontent” has approached the Dutch shores. At the same time, delays in implementing climate change policies lock up vital parts of the Dutch economy, including the construction industry, such delays coming at high expense, inflationary risk, and with anticipated diminishing returns for the Dutch economy.

Beijing’s recent clampdown on China’s overleveraged real estate sector is yet another example. It illustrates how financial distress can spread with the speed of light through the economy. As long as it was assumed the debts of the imperiled Chinese real estate sector would be resolved by Chinese government guarantees, few cared about how debt payments would be allocated. Once the market understood, however, these debts would no longer be guaranteed, each player in the Chinese real estate sector, from developers and contractors, to homebuyers and local governments, worried about how the default costs would be directly and indirectly distributed. Stakeholders changed their behavior overnight. Lenders withheld credit, suppliers halted deliveries, homebuyers postponed their purchases, and Chinese local governments, suffering from steep revenue declines, cut back on spending and called in their loans. As they did so, the problems within the Chinese real estate sector quickly deepenend and spread to other, less-leveraged developers, and to upstream and downstream suppliers and customers. Once this happens, only credible guarantees of the debt can prevent a situation from spiraling out of control, in the absence of which, debtrelated uncertainty is likely to virulently spread through the real economy.
Interest rates are not the only transfer mechanism by which central banks and goverments can restore the balance. Financial repression, capital controls, and wage repression are other mechanisms. To understand the devastating effects of exponential high debt levels on an economy, it is important to understand what these mechanism are, including: (i) inflation, which erodes the value of fixed incomes and financial assets; (ii) higher income taxes, shifting the cost of the debt burden onto tax payers, by reducing consumption and cutting disposable income; (iii) wealth and property taxes, shifting the cost of the debt burden onto the wealthy (although taxes would have to be very high to have any measurable impact); (iv) tariffs, shifting the cost of the debt burden onto importers, including all consumers, reducing the real value of household income and consumption, relative to total production; (v) currency depreciation, shifting the cost of the debt burden onto domestic importers; (vi) trade deficits, in countries in which investments are not constrained by low savings, which force down domestic savings, shifting the cost of the debt burden onto workers; (vii) shortage of consumer goods, shifting the cost of the debt burden onto ordinary households, enforcing involuntary savings; (viii) financial repression, often in the form of distorted deposit rates, with a similar effect as inflation, shifting the cost of the debt burden onto middle-class and working-class savers, in particular in countries where the banking system is highly controlled; (ix) raising or lowering energy or other (food) commodity prices by governments or monopoly buyers and sellers, shifting the cost of the debt burden from producers to consumers; (x) wage repression, shifting the cost of the debt burden onto workers, in particular in globalized economies where corporations try to keep wages down to increase competitiveness; (xi) reduced business profits, shifting the cost of the debt burden onto corporations, often resulting in lower levels of business investment; and (xii) falling government spending, usually combined with increased taxes, shifting the cost of the debt burden onto the military and public services, including health, education, and elderly care.
The above is short for “Runaway Debt And What Governments Do With It”. Governments distorted demand-supply policies during the pandemic, by increasing the demand for consumer goods, which led to high inflation and exponential high public debt levels. They continue to increase net public spending since the end of the pandemic. It is a typical case of “take three, promise one”. In 2021, government expenditure as percentage of GDP in France accounted for 59.05 per cent of GDP, with Italy (55.45 per cent) and Spain (50.6 per cent) closely following. Japan’s government was at 42.52 per cent. The US went from 19 per cent in 1972 to 42.36 per cent in 2021.
High debt levels and low interest rates lead to the creation of fictitious wealth, which, at least temporarily, boost domestic demand and economic activity. It normally consists of soaring prices for securities, real estate, and other assets, prices that exceed levels justified by their future real contribution to the production of goods and services. Examples abound in real estate, technology, and crypto-related industries, leading to wildly speculative behavior. Here the perception of wealth far exceeds the reality of wealth. The link between fictitious wealth and high debt levels is the rapid expansion in the availability of underlying cheap liquidity. When liquidity tightens, asset prices start to decline and bubbles start to burst, usually quickly. Until then, many of us are living the Jazz Age of global finance.
Where debt is spend for non-productive investment, as has been the case in China in recent years, in Japan in the 1980s, and is happening today in the US and EU, this results in an increase in income and economic activity which cannot be justified by a real increase in the future value of the underlying goods and services. Expenditures that should be expensed are in fact capitalized, causing income statement expenses to be understated and balance sheets to be overstated. This pushes net wealth to higher levels than would have been the case if productive activity had been recorded. The conditions that create this fictitious wealth are reversed once debt levels start to decline and interest rates start to go up. Corporations and households feel collectively poorer than before, and, as the value of their collateral continues to decline, they come under increasing pressure to pay down debt.
Several economists argue that debt only is a problem to the extent that it leads to a financial crisis. I do not agree to this. A financial crisis is simply another mechanism by which governments can adjust an economy from exponential high debt levels, by locking an economy into stagflation, through major political crises, or when restructuring debt during external shocks.
There are winners and losers in an inflationary environment, and it is important to understand the ramifications. Many walk into the new era eyes wide shut, assuming that the world ahead will be like the world as it was. These views, I prefer to call them belief systems as they lack any data support, are as real as thinking that one can fly. To sum up the urgency: one cannot borrow one’s way out of debt forever, and global debt levels continue to rise rapidly. There are significant parallels between the risks that are reshaping the current world order and those of the 1918s/1920s: rising global debt levels, the end of a pandemic, the proliferation of new technologies, political polarization, geopolitical rivalries, a soaring stock market, the explosion of demand, and supply pressures. If these risks materialize at the same time, the world will find itself in a perfect storm.
Spending Blitz
As the Global Financial Crisis of 2007-2009 receded, many expected to see a wave of deleveraging. It never came. The combined global debt of governments, nonfinancial corporations, and households had grown by $72tn in 2018. Since then, governments in developed and emerging countries have continued to borrow heavily, as have nonfinancial corporations around the world. China alone accounts for more than one-third of global debt. Public debt already mounted before the Global Financial Crisis, in the 1980s and 1990s. It swelled further as the crisis of 2008 caused a drop in tax revenues and a rise in social welfare payments. Countries as the US and China embarked on fiscal-stimulus policies, other governments recapitalized systemic banks and institutions. A crisis that began in the private sector, shifted to governments. Between 2008 and 2021, global public debt more than doubled.
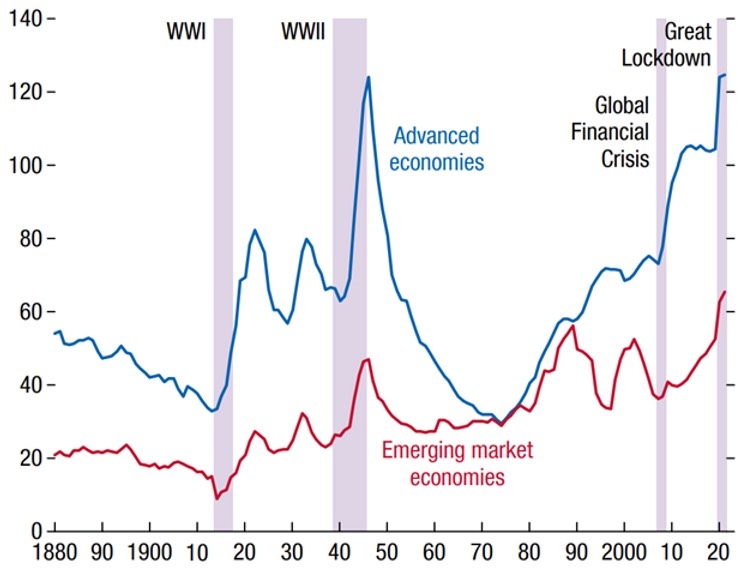
Figure 1. Historical global public debt trends. 1880-2020. Sources: IMF, Historical Public Debt Database; IMF, World Economic Outlook database; Maddison Database Project; and IMF staff calculations. Note: The aggregate public-debt-to-GDP series for advanced economies and emerging economies is based on a sample of 25 and 27 countries, respectively, weighted by GDP in purchasing-power-parity terms.
In emerging economies, public debt reflects the scale of investment required to industrialize and urbanize these countries. A series of investment policies have been erratic or inefficient, and assets mispriced. Where emerging economies’ governments resorted to financing large public administrations, inefficient stateowned corporations, or “hot investment ideas” during bull markets, results have been negligible in terms of value-add to GDP.
Although public debt in emerging countries remains at lower levels than in developed countries, the former are under severe debt distress. Two-thirds of recent growth in global corporate debt comes from emerging economies.
Corporate lending from banks has turned flat, and nonbank lenders, including private equity funds and hedge funds have become important sources of alternative credit for these markets.
Geopolitics | The Known Unknowns
Several developments are causing radical global change. Ray Dalio refers to the first development as the enormous and ongoing amount of debt creation and monetization of debt. March 2022 ended the period during which central banks gave away money and credit essentially for free, a policy that took off during the Global Financial Crisis. Central banks are striving to achieve balance and are raising interest rates.
It may not be enough. Or a long way off. Structural factors dampen the impact of monetary tightening. Whereas activities in riskier capital markets, such as leveraged loans and private credit, have slowed, and private equity funds and hedge funds have experienced substantial outflows, David Ivascyn of Pimco, the world largest active bond fund manager, declared he is preparing for a “harder landing”, referring to a legitimate real inflation problem, and warning markets are too confident in central banks’ ability to cut interest rates as quickly as yield curves are implying. Based on historical data, Ivascyn indicates a lag of 5 to 6 quarters before the impact of rising policy interest rates will be felt. Coinciding with his comments, on 30th June 2023, the Nasdaq Composite index recorded its strongest first 6 months in 40 years. Core inflation hoovers around 5 per cent in the US and EU, while inflation in the UK surged to 7.1 per cent in May 2023.
The aggregate impact of rising interest rates on household’s net interest income has been limited. Interest rate payments as a share of disposable income are still only a fraction of what they were 10 to 15 years ago, as banks are slow to pass through interest rate increases to deposit rates. Fixed mortgages are popular. The UK, where floating mortgages went down from 70 per cent in 2011 to 10 per cent in 2023, is a telling example. Labor demand in developed countries remains strong, increasing the bargaining power of workers in a period in which wages are already expanding at a high pace. As I will describe, governments continue to provide large-scale stimulus, each for political reasons of their own. In a sobering comment, Isabel Schnabel, Member of the Executive Board of the ECB, projected that only half of EU governments’ ongoing covid-19 stimulus programs will be reversed by 2025, something that has an inflationary effect in itself. Discussions on binding government expenditure ceilings drag on in the EU, while the public debt ceiling in the US continues to be raised. To ask why governments continue to raise public debt levels would be an intelligent question. For the answer lies in politicized money.
When interest rates are so low that conventional rate cuts can no longer further stimulate the economy, central banks can directly intervene in financial markets and buy assets from the sovereign and corporate sectors. A well-known example is the Bank of Japan (BOJ), which at the end of 2022 owned a staggering $4.15tn or 50 per cent of the Japanese government’s outstanding bond balance, up from 11.48 per cent in 2013. In an attempt to prop up the Japanese economy, BOJ is a major shareholder in about 40 per cent, or 1,446 out of 3,735, of listed companies, totalling $227bn of equities, as a result of purchasing exchange-traded funds. In 2022, Japanese bonds suffered from appraisal losses as market prices of Japanese governments fell below their original purchase price. There is a risk that BOJ’s liabilities could eventually exceed its assets if interest rates rise substantially.
Although BOJ is supposed to be an independent institution, its monetary policy has effectively integrated into the Japanese government’s fiscal policy, with the central bank monetizing debt by bankrolling government’s fiscal deficits. Understandably Japanese political leaders showed little eagerness to restore fiscal discipline since this ultraloose monetary policy took off, and runaway debt has gone everywhere. Inflationary pressure triggers social unrest. Politicians face “doomed if you don’t, damned if you do” scenarios when confronted with the need for fiscal austerity. Few public office holders in developed countries will turn against their electoral supporters if they can avoid it. Instead tactics are applied that, in the spirit of Charles Lindblom, can best be described as “muddling through”, giving way to the messy day-to-day reality of the politics of public policy making, of discouraging rational analysis, and bringing about a state of disorder and disinformation, a process that is taking place in societies with ever-widening divides in income and social justice, and where trust in national governments and political leaders has reached dangerous historic lows, opening doors to violent disaccord and civil war. Events that, in my view, carry a high probability of occurrence, with more and more violence between citizens and governments unfolding in the streets of France, Israel, Iran, Sri Lanka, and the United States, to mention a few places out of many. Much wealth has accumulated in the hands of few. Much credibility has been wasted by governments and political leaders who have disengaged themselves from their electorates.
It is an undesirable paradox that fiscal austerity policies imposed by autocratic governments, which dominate domestic financial institutions, suppress public opinion, and are firmly in control of their citizens, may be more effective than fiscal austerity policies of democratically elected governments in developed countries. The latter, subjected to regular and free elections, fragile coalition arrangements, independent courts, largely unregulated social media, and persistent rioting and civil unrest, may be more able to absorb the social and political costs of financial instability, but also risk vigorous opposition and new elections when imposing fiscal austerity.
Risk for inflation persistence is underestimated. Aside the time lag Ivascyn refers to, disinflation to date has been primarily driven by a reversal of supply shocks. Research by the Federal Reserve Bank of St. Louis indicates that food price inflation has strong predictive power for future headline inflation, more than other components of core inflation. Considering the uncertainty surrounding the war in Ukraine, there certainly exists further upside risk to food inflation. Neither is it possible to exclude risks triggered by the “known unknowns”, such as supply shocks, pandemics, cyber attacks, natural disasters, or war.
If we believe the current debt cycle, that started in the 1945 post-war period, is nearing its end, then based on historic data we can anticipate the current debt cycle will play out as previous long debt cycles have done. This takes the form of higher interest rates for a longer time, tighter credit, higher than anticipated inflation, higher taxes, restrictions on capital and trade flows, slowed economic growth, and a reset of prices and returns of asset classes. One only needs to read the daily newspaper to find ample reporting on the same.
Catch Me If You Can
Exponential high debt levels incur financial distress costs which undermine real economic growth and financial stability. When this happens, corporations and households start to shift their wealth into movable assets or into foreign currency (capital flight), consumers cut back on spending, homebuyers and equipment buyers delay purchases, manufacturers move operations abroad, farmers hoard production or cut back on land development, and workers unionize, protest, or work less efficient. In politically volatile markets, foreign investors fear for disproportionate taxes, expropriation, or for being politically targeted, and liquidate assets and move abroad. Lenders withdraw from markets, anticipating constraints in the repatriation of capital. Governments historically reply to financial distress behavior by cutting back on public spending, expropriation, exit taxes, and by financial and political repression, to stem the tide in their favor. This in turn depreciates the value of a country’s institutions, infrastructure, manufacturing facilities, and services, which makes it harder for governments to repay their debt.
Geopolitics | The Known Unknowns Part II
The second major development is political fragmentation and conflict, both domestically and externally. Since the end of the Cold War, a system of global bipolar stability has made way for an unpredictable array of forces, including the decline of the US as global superpower, and the rise of China as an emerging global superpower, a situation that shows similarities with the Europe of 1914. Russia has installed tactical nuclear weapons in Belarus. NATO member-states provide Ukraine with long-range F-16 fighter jets. Taiwan could fall prey to an economic blockade by China, resulting in further major disruption of the global economy, at an estimated cost of $2tn in global GDP. An increasing number of densely populated territories in Asia and Africa turn into geopolitical no man’s lands, and are left to themselves, beyond the pale of international law, with Afghanistan, Somalia, Yemen, Ethiopia, Myanmar, Democratic Republic of Congo, Mali, and Niger, as telling examples. The ripple effects of these combustible no man’s lands, characterized by civil war, ethnic conflict, autocratic regimes, terrorism, corruption, poverty, illicit trade, and climate disaster, will be felt around the world for decades to come. The overall risk levels for escalation are higher than at any other time during the 1945 post-war period.
Thirdly, we live in an economic multipolar order, with the US and China economically too interdependent to decouple from each other, with bilateral trade between the 2 countries hitting record highs amidst rising trade tensions, and most other countries vying for access to the 2 largest markets in the world. The European Union is still the largest common market, Japan hangs on as global economic power, and India’s economy is growing rapidly, as is its influence on the geopolitical stage. Through it all, the outcomes of loose monetary policies, which found their peak during the pandemic, have contributed to more financial instability.
The global economic and political order continues to swift in the coming decades. The geopolitical architecture is no longer aligned with the underlying balance of economic power. This leads us into a new era, where the balance of power between superpowers, and between traditional G-7 and emerging economies, is undergoing profound and irreversible change. Firm believers in free markets, including Lionel Robbins, warned years ago that the decrepit political foundations of the 1945 post-war period would not support a globalized economy, and there was a real risk that it could turn into a zero-sum game. But in the early 1990s, these warnings fell on deaf ears, with US hegemony the closest thing to a world government, China opening to foreign trade and investors, and the former Soviet Union ending in collapse. I recall my meeting with the Head of Legal at Shell in the summer of 1990, after I had completed my PhD on the law of war, who relished in his thinking that war had ended forever. As an international lawyer I could not haven chosen a more irrelevant area of study, the gentleman opined, hence putting my legal career at risk and becoming the laughing stock of my peers. Rarely had I been seated opposite such an astounding lack of historical insight.
The New Era
Globalization comes in waves and recedes. The first wave took place between 1870 and 1914, and was enabled by large scale reductions in transportation and communication costs, followed by mass electrification. By 1913, commodity markets were globally integrated, the gold standard maintained fixed exchange rates, and capital flowed freely and with little risk. Globalization came under the Anglo-American control of the transatlantic economy. The age of liberalism and economic integration was followed by two world wars, separated by the Great Depression. Trade shrank to levels seen before in the 1800s, capital flows dried up, governments imposed tariffs and capital controls to protect industry and employment. The largest economies separated into regional blocs. Germany, Italy, and Japan unsuccessfully went to war to establish geopolitical blocs of their own, with Nazi Germany waging economic war for “Lebensraum” (a philosophy shifting the conquest of overseas colonies to the idea of conquering territory in Eastern Europe for German agricultural and settlement purposes, as had been advocated by the Pan-German League and radical-conservative publicist Friedrich von Bernhardi); the conquest of natural resources (in particular in the Soviet Union); and forced labor on an unprecedented scale as part of Germany’s economic exploitation of occupied territories.
The third wave of globalization began in the 1980s and accelerated following the end of the Cold War, when digital technology allowed the outsourcing of lowcost manufacturing and services, and the development of globally integrated supply chains. It ended with the onset of the Global Financial Crisis. Global trade-to-GDP fell from 61 per cent in 2008 to 56 per cent in 2022. Today the US and China lead the formation of separate geopolitical blocs. International corporates, hedging their risks in a rapidly emerging protectionist world, are moving from singular headquarters towards expanding their local capabilities in key global markets.
With the world at an infection point, we need to understand the new forces that shape the global economy. Digital technologies change productivity and competitiveness. Global output is expected to increase with 30 per cent and production costs to decrease with 30 per cent, making it possible to bring back manufacturing plants to developed countries. This will have an impact on global manufacturing, and on trade in goods and services between developed and emerging economies. Global digital platforms and their supply systems replace costly systems from the past. Cheap labor in emerging economies may become less relevant when production costs elsewhere can be sharply reduced. This will force emerging economies to focus more on their regional markets and on technological innovation.
Decentralization of global public governance change the rules of engagement of supranational policy-making. The creation of the G-20 in 1999, incorporating the leading emerging economies, signaled a first seismic shift in the global economic power structure. The new members were not at the same stage of economic development as the original G-7 countries, they had different economic structures, including state domination of their financial systems, different political systems, emphasis on state regulations, as well as a majority of familyrun business conglomerates. This made achieving consensus on economic policies for global financial and trade flows challenging. It resulted in the decentralization of financial and trade institutions, and the development of regional and sub-regional trade agreements, such as the Trans-Pacific Partnership. The number of active regional trade agreements increased from 50 in 1995 to 280 today. More recent established financial institutions are dominated by China and a group of emerging economies, such as the Asian Infrastructure Investment Bank (AIIB) and the National Development Bank, each with a starting fund of $100bn, and potentially large enough to signal a shift in power away from institutions such as the Asian Development Bank, World Bank, and IMF.
Dangerous Debt
Against this background, the surge in global debt is one of the most critical trends to watch. More than 80 per cent of the new debt burden in 2022 came from emerging economies, where total debt is approaching $100tn according to the IIF. China, Mexico, Brazil, and Turkey posted the largest increases. 15 Per cent of low-income countries are in debt distress, and 45 per cent are at high risk of debt distress. Credit has been rationed, and 1 out of every 4 emerging economies has lost access to international bond markets. Since February 2022, the cost of borrowing for C-rated borrowers has surged by 14.4 per cent. Many emerging economies have become reliant on off-budget borrowing, resulting in exponential surges in nonfinancial corporate debt levels in countries such as China, Russia, and Saudi Arabia.
Cost of Debt Servicing In Emerging Economies
Emerging economies are facing strong headwinds, driven by high debt levels, higher costs of debt servicing, and weakened investment. The majority of low income nations are on the edge of a severe debt crisis, sparking fears of global contagion. Although larger emerging economies have so far managed the sharp tightening of monetary policy in developed countries, there should be no doubt that, if the current constraints in global financial markets do not subside, and cause a further pullback from global risk taking and capital outflows, these markets will be heavily impacted. Already 12 emerging economies sovereigns are trading at distressed rates, and an additional 20 trade at spreads of more than 700 basis points, which makes market access challenging, and debt servicing more expensive. Emerging economies have also been more affected by food and energy inflation. Average house prices in emerging economies fell with 60 percent in 2022, while in developed countries house price increases started to slow in the same period. The rising debt servicing burden, if left unchecked, will result in widespread public debt crises through emerging economies.
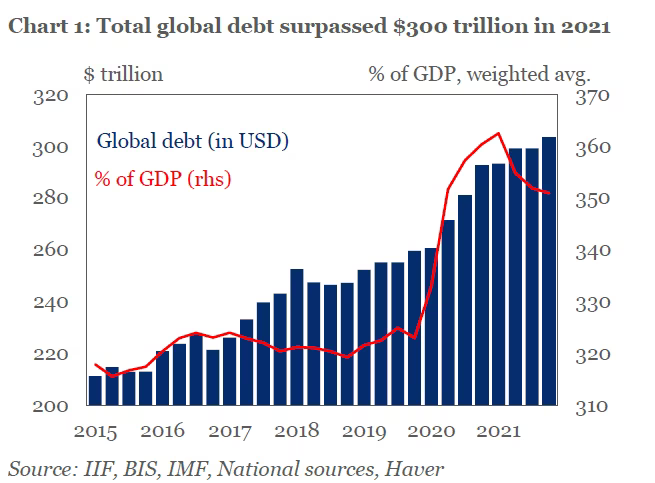
Figure. 2. Total debt as percentage of GDP. Source: IMF Global Debt Database (2021).
Emerging economies are a heterogenous group. Investment-grade emerging economies have access to capital markets. Their debt is mostly denominated in domestic currency, they can issue at long tenors, and they have reasonably deep domestic capital markets. The mid-tier group of emerging economies relies on foreign-currency denominated loans from capital markets. Both groups face currency depreciations, sudden stops in capital flows, and rising debt stocks. Rating agencies have downgraded a large share of emerging economies’ sovereigns during the pandemic, resulting in further deterioration of creditworthiness and financing conditions.
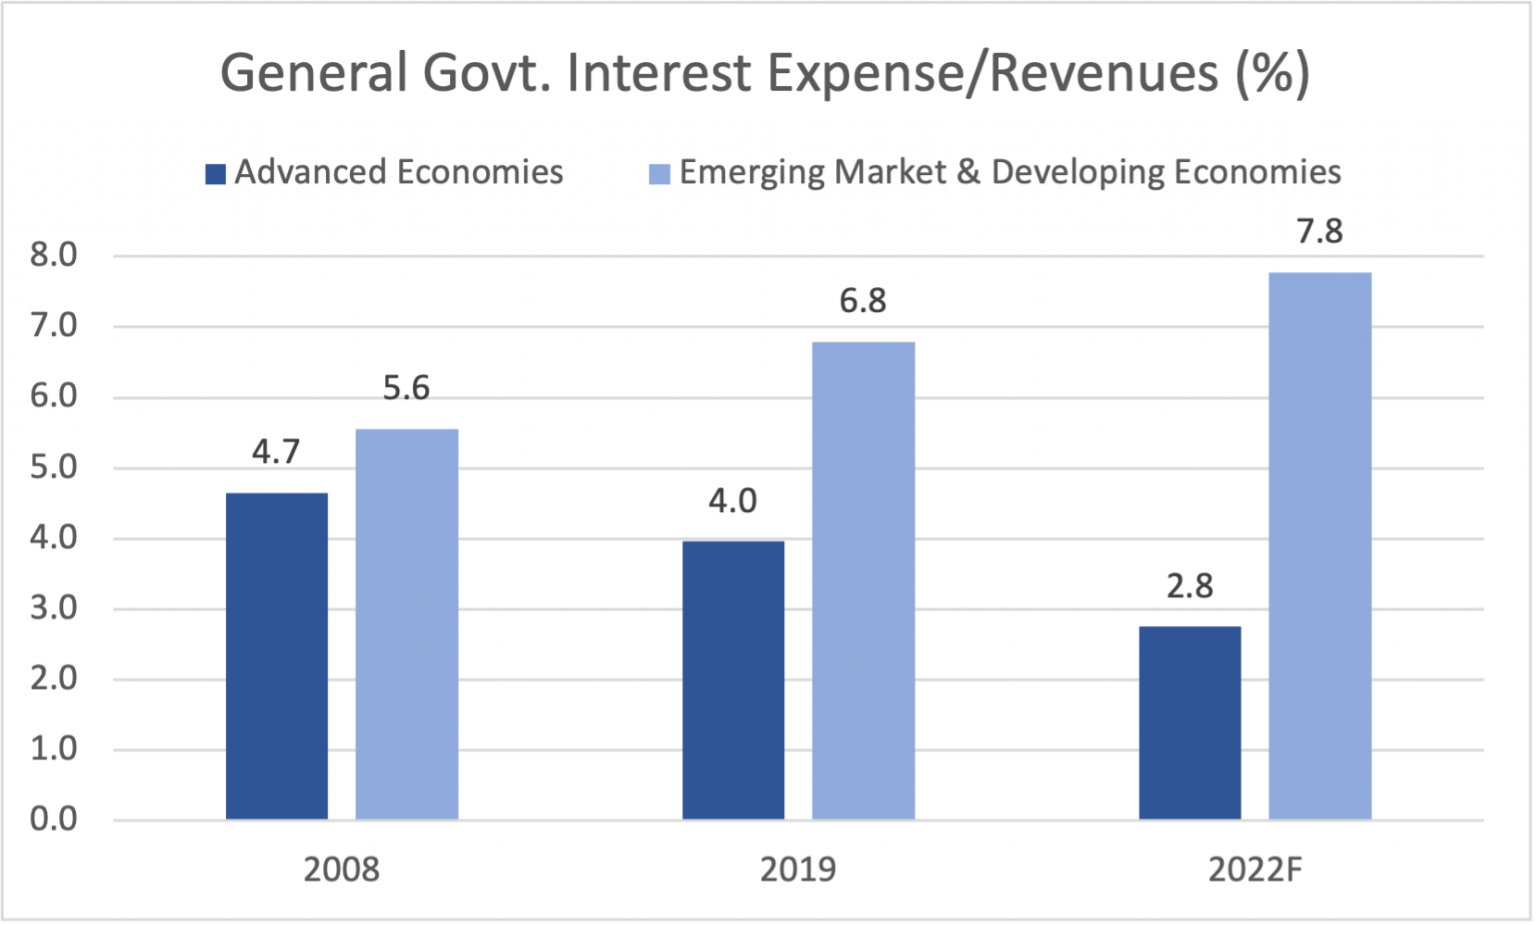
Figure 3. General government interest expenses/revenues ratios. Source: Georgetown Journal of International Affairs (2021).
As a result, debt affordability for emerging economies has declined with 50 per cent between the Global Financial Crisis and pandemic, whereas for developed countries it has improved by around 50 per cent, supported by, you guessed it, loose monetary policies to suppress borrowing costs in these countries. As Figure 3 illustrates, this has widened the gap of the cost of debt servicing between developed countries and emerging economies. The sobering reality is that the richer a country is, the higher the public debt level it is able to sustain, at lower cost and without risking a default.
Why It Matters
It is difficult to underestimate the long-term fundamentals underwriting the explosive growth of emerging economies, in particular in Asia and Africa, as they are quickly becoming the new powerhouse of the global economy.
The top 7 emerging economies are projected to comprise 50 per cent of global GDP by 2050, with the G-7’s share declining to just over 20 per cent of global GDP, leading to a radical change of the global economic order in the coming decades.
In total 6bn people, or about 85 per cent of the world’s population, live in emerging economies, including China, by the definition of the IMF. By any measure, these populations are significantly younger than those of developed countries and populations are growing exponentially faster. Urban populations are soaring, with over 90 per cent of urban population growth taking place in emerging economies, where an estimated 70m new residents migrate to urban areas annually. Nearly 50 per cent of the global population will live in emerging economies cities by 2030. Of the world’s 25 largest megacities, 16 are situated in emerging markets. The fastest growing megacities in the world, Lagos and Dhaka, have doubled in size since 1990. By 2025, Dhaka will be larger than Mexico City, Shanghai, or New York.
Infrastructure investment in emerging economies’ cities is forecasted at $30tn to $40tn, half of the total global infrastructure investment in the next 2 decades. Infrastructure is also the main driver of population growth, in particular in Africa and Asia, as construction and maintenance of transport systems determine whether cities will succeed economically. In many cities, infrastructure investment is not keeping up with population growth, posing challenges as well as opportunities for investment and business in these areas. The size of middle class cohorts is projected to increase from 3.2bn in 2020 to 4.9bn by 2030, with the bulk of growth occurring in Asia.
Emerging economies will continue to grow faster than developed countries. Between the Global Financial Crisis and the pandemic, the competitiveness of emerging economies currencies was already notable. Current accounts reflected improvements in exports and deficits shrank, benefiting the capital accounts of these countries. At the onset of the pandemic, emerging economies jointly controlled 76 per cent of global foreign exchange reserves. Improved access to global capital markets enabled the flow of global capital to these markets, and provided opportunity for governments and corporations to search for the most accessible and cost-effective markets in which to raise capital.

Why it matters. Goldman Sachs projects that emerging economies’ share of the global equity markets will rise from about 27 percent currently, to 35 per cent in 2030, to 47 per cent in 2040, and 55 per cent in 2050. India is expected to have the largest increase in global market cap share. This follows the trends of a strong demographic outlook and growth in GDP in emerging economies. China’s share is projected to rise to 15 per cent in 2050, and, due to a demographic slowdown in growth, to decline to 13 per cent in 2075. The US share of equity market capitalization is projected to fall from 42 per cent in 2022, to 35 per cent in 2030, to 27 per cent in 2050, and 22 per cent in 2075. As emerging economies further expand, their relative contribution to global financial markets risk will increase substantially.
Reversal Of Fortune
Global debt reached a near record of $305tn in Q1 of 2023, covering borrowing by governments, corporations, and households, or 349 per cent of GDP, $45tn higher than before the pandemic. Global public debt stands above $96tn, or 96 per cent of global GDP, with lockdown support policies and Europe’s energy subsidies since the war in Ukraine to blame. Nonfinancial corporates account for more than 14 per cent of global financial markets, with most of the growth caused by a rapid expansion of US investment funds and private debt markets. Gross federal debt of the US surpassed $32.47tn in June 2023, with the US spending nearly $2bn per day on interest payments on debt.
Moody’s has issued a warning that the $1.4tn private credit industry is facing challenges, as tens of billions of $ dollar loans have been underwritten at the top of the market against close to zero interest rates, and are today strained by sharply higher interest rates and a slowed economy. Many of these loans carry a junk status, and have been provided to borrowers that banks could not finance, and are based on future receivables. Earnings available to these borrowers to make future interest payments could fall dramatically, according to some projections up to 50 per cent.
The global debt of $305tn translates into $37,500 of average debt for each person in the world versus GDP per capita of $12,000. Based on statistical averages, today each of us owns 3 times more debt than income. Higher global interest rates translate into annual global interest expenses of $3tn (assuming 65 per cent of debt is fixed) in the years to come. S&P Global predicts the global debt-to-GDP ratio to further increase to 366 per cent in 2030, up from the 349 per cent reached in 2022. Debt is the preeminent risk to global financial and political stability in our time, together with fragmentation and climate change. An astounding reversal of fortune, considering that the size of the global economy almost tripled since the end of the Cold War. The situation is as unsustainable as it is undesirable.
The situation is worse in emerging economies, which, as I explained above, are the fastest growing markets of the global economy, representing 85 per cent of the world population. With the interest rate differential between emerging economies and developed countries diminished, local currency debt has become less appealing to foreign investors. The largest part of emerging economies debt in 2022 was in local currencies, its share the highest since 2003, as the appetite of foreign investors for local currency assets fastly dwindled to 18 per cent foreign participation in local bonds markets, the lowest level since 2009.
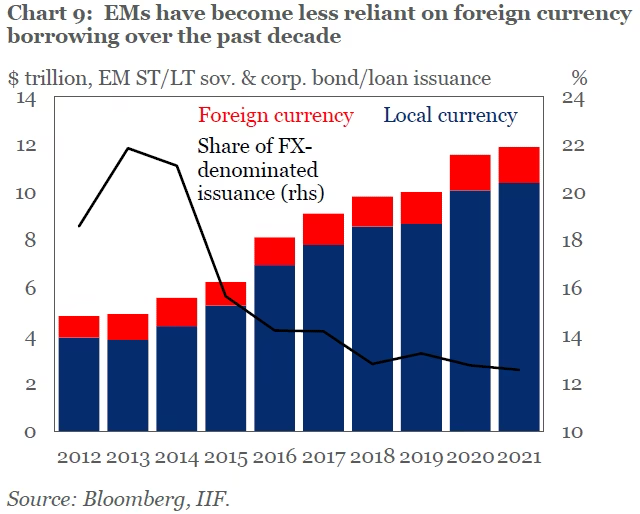
Figure 4. Emerging economies borrowing in foreign and domestic currencies 2012-2020. Source: Bloomberg, IIF (2021).
With public debt issuances hitting a record high, countries as Pakistan, Kenya, and Tunisia will need to find alternative sources of financing if capital markets do not re-open for them. Kenya’s $2bn bond matures in June 2024, while Tunesia, a CCC rated country for which Fitch considers default a real possibility, is facing an overseas bond of $500m maturing in October 2023, and a bond of $850m in February 2024. Ethiopia has a $1bn Eurobond due in February 2024. JPMorgan’s emerging markets bonds index (EMBI) for high yield debt is at 900 basis points over US Treasuries.
As Long As It Lasted
The global economy provided a more favorable climate for emerging economies during the 1990s. Inflation and interest rates in developed countries remained low. Declines in asset yields in developed countries made emerging economies more attractive to investors, and risk premiums decreased. Private capital flows to emerging economies surged during the 1990s, while official capital flows declined sharply, from 49.5 per cent of total capital flows in 1970-1981 to 9.5 per cent in 1990-1996. In 1996, net private capital flows were $190bn, almost 4 times larger than in 1990, with 5 emerging countries accounting for more than 50 per cent of total inflows, mostly concentrated in Asia and Latin America. There was a dramatic change in the composition of these private capital flows, with the share of foreign direct investment (FDI) and private portfolio inflows increasing relative to bank and multilateral lending. Net capital flows to emerging economies soared to $ 1.04tn during 1990-1996.
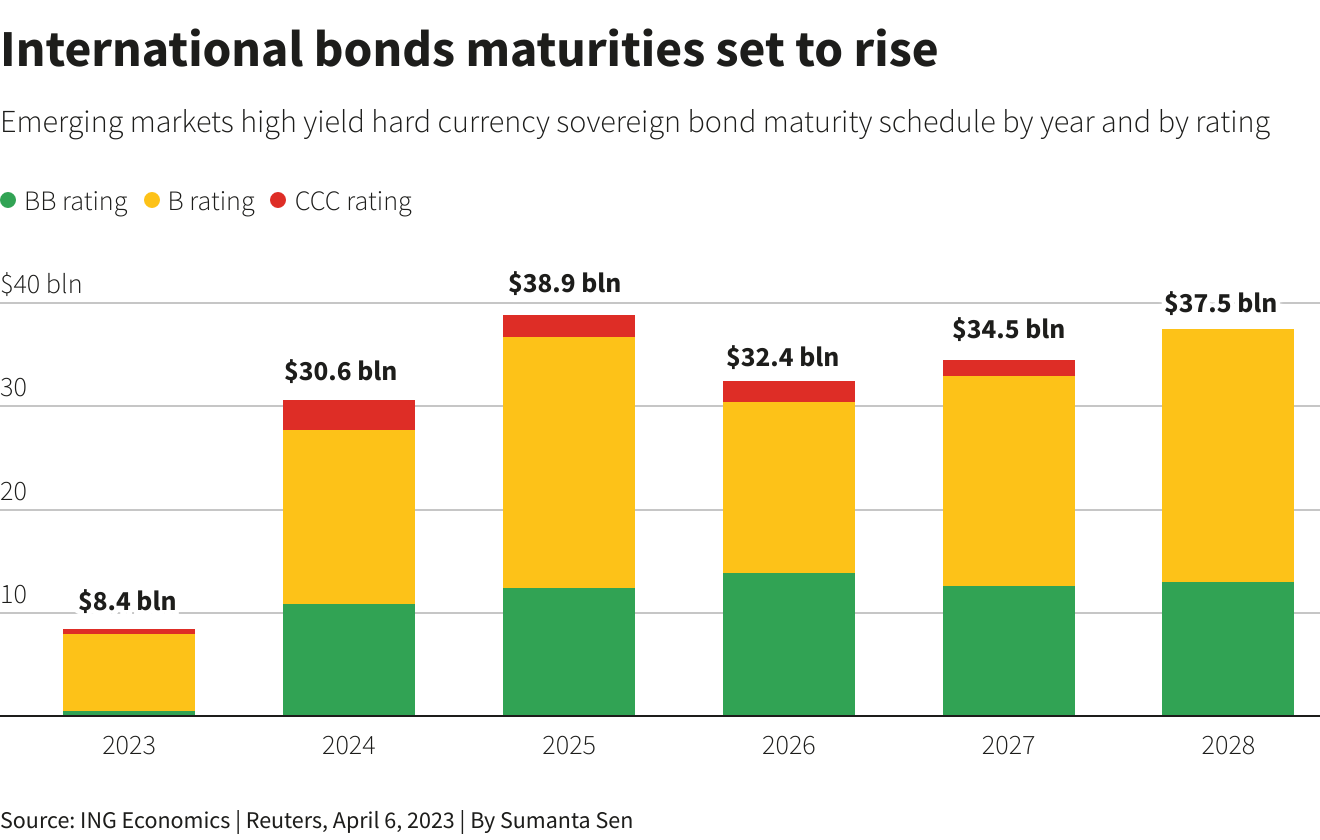
Figure 5. Emerging economies international bonds maturities 2023-2028. Source: ING Economics, Reuters (2023)
Foreign lending continued until in the 1990s the eventual upswing of the $ dollar, the Mexican crisis of 1994, and the Argentinian and Asian crises of 1997, undermined the competitiveness of emerging economies with currencies pegged to the $ dollar. When commercial lending dried up in the wake of these debt crises, local currencies plunged, and governments and businesses ended up highly overleveraged.
Today’s situation evokes memories of past public debt defaults. Although all countries accumulated massive debt during the pandemic, the recovery in emerging economies lags behind their advanced counterparts. Tighter monetary policies in developed countries have pushed up interest rates, while shorter debt maturities of emerging economies carry a higher default risk. The Debt Service Suspension Initiative (DSSI), implemented by the G-20 in 2020, resulted in 73 emerging countries paid neither interest nor repaid their debts from May 2020 to December 2021. The Common Framework for Debt Treatments, an initiative endorsed by the G-20 and the Paris Club, has achieved precious little. Chad, Ethiopia, and Zambia applied for debt treatment under the Common Framework. Chad reached agreement with the creditors committee comprising of China, France, India, and Saudi Arabia, as well as with private creditors, in November 2022. Ethiopia, facing a financing gap of $6bn or more until 2026, submitted a request for $2bn in financial assistance to the IMF in April 2023, after its initial application in March 2021 under the G-20 Common Framework had been delayed by the outbreak of civil war in November 2020. Rhodium Group believes a handful of countries, including Myanmar, to have signed DSSI referrals, but amounts have not been validated. Meanwhile, the Ethiopian government continues its discussions with the G-20 creditors committee.
Zambia, the main sovereign casualty under the pandemic, announced at the Paris summit in June 2023 that it had, after several years in-waiting, reached agreement on a $6.3bn debt restructuring plan with China and several government creditors, including from France, South Africa, Israel, and India. Yet within days after the Paris summit, it was revealed that China’s EximBank might not have been speaking for all of China’s lenders in the course of negotations, and remained insistent on extending loan terms and adjusting finance costs.
Rhodium Group estimates new public debt negotations and zero-interest loan write-offs involving Chinese creditors totaled $9bn in 2022, a decline from 2021 ($19bn). Emerging economies during the pandemic resorted to regulatory forbearance and guarantees, to mitigate the negative impact of the global economic standstill. It is unknown how many of these contracts remain off the radar. Undisclosed collateralized bonds owned by private creditors, opaque oil trading agreements, and Chinese loans secured by pledged shares and future accounts receivable, increase the risk of widespread default.
Public debt rises are driven by downgraded credit ratings, exchange rate depreciations, foreign currency debt, and contingent liabilities. In 2022, Zimbabwe’s dollar, Ghana’s cedi, and Sierra Leone’s leone were amongst the most devalued African currencies against the $ dollar, with depreciation rates of respectively 323.4 per cent, 42.5 per cent, and 34.0 per cent. In economies such as Egypt, Kenya, Nigeria, and South Africa, which are more integrated in the global markets, currency weaknesses continue to persist in 2023. Although the median public debt in Africa is estimated to have declined to 65 per cent of GDP in 2022 from 68 per cent in 2021, average public debt levels remain above the pre pandemic level of 61 per cent of GDP.
What stands out in the discussion on debt owned by emerging economies, is the narrative on China’s debt trap strategy, in particular in Africa. We have to ask ourselves: fact or myth? Lack of transparency, data gaps, and a myriad of bilateral loan commitments prevent a complete overview of China’s overseas lending. China is not a member of international creditor organizations such as the Paris Club that provide data on lending and restructuring. Chinese overseas lending between 2012 and 2017 increased with 25 per cent per annum. This corresponds with the early years of China’s Road and Belt Initiative, when a sweeping policy plan to finance infrastructure development across emerging economies was put into action. 139 Countries reportedly signed Road and Belt Initiative cooperation agreements or MOUs. According to China’s IIP, overseas lending increased by $392bn from late 2019 through June 2022.
Colombo 10
In May 2023, The Atlantic published an article on China’s debt trap, which critically analyzed the narrative on China weighing down emerging economies, in particular on the African continent, by providing loans. In 2018, US VicePresident Mike Pence dubbed it “debt-trap diplomacy”, with China aiming to ensnare emerging economies with unsustainable levels of unproductive debt, by building economically non-viable infrastructure projects, and eventually by taking control of these strategic assets, evidence of China’s military ambitions and willingness to support autocratic regimes. Pence singled out Sri Lanka’s port Hambantota as a defaulted asset that ran the risk of being transformed into a forward Chinese military base. Pradeep Mehta, secretary general of Genevabased CUTS International endorsed this view, stating that, “Through the Belt and Road Initiative China is investing heavily in the East African region to reshape the political and economic narrative. (.. ) In its strategy, Beijing seeks to influence global supply chains, diverting the flow of international trade via critical sea lanes and seaports. Positioned alongside the Indian Ocean region, the East African Community (EAC) lies in direct vicinity to a maritime route that is vital for global trade and security”.
Debt does not equal debt trap. Providing debt to economies is instrumental to economic development. Former Kenyan President Uhuru Kenyatta once declared, “The debt problem in essence does not concern the occurrence of debt, but the use of it. Currently only 60 per cent of the population in Kenya have access to electricity, and that is why I want a loan“. Ethiopia’s ambassador to China, Teshome Toga Chanaka, refuted the debt trap narrative and declared, “A partnership that does not benefit both will not sustain long”. Other African politicians have expressed concern over Chinese loans. Although China has canceled interest-free loans in Africa since 2000, it has not canceled interestbearing commercial loans to assist distressed borrowers. China also continues to negotiate loan suspension agreements bank-by-bank, independent from the Paris Club creditors.
Facing Debt Fires
Chinese overseas infrastructure lending is provided through US denominated commercial loans at or near market rates. Loans are focused on energy, infrastructure, and natural resources-related projects, and are collateralized with future commodity export receipts or revenues. An estimated 10 per cent of Chinese loans have more favorable concessional terms, compared to financing provided by non-Chinese bilateral aid agencies and multilateral development banks. Benefits for the Chinese government include securing natural resources that China lacks domestically in sufficient quantities; creating overseas demand for Chinese industrial outputs; recycling excess foreign currency from persistent trade surpluses; competing for market share abroad; and geopolitical objectives. G-20 countries, including the US, Japan, and Europe, use similar strategies, including state guarantees and development loans, to extend their overseas market share and increase demand for their domestic output. China’s strategy in many ways resembles that of the US when it started its rise as global financial power in the 1930s and during the post-1945 period, offering rescue loans and bailouts to impoverished countries in Europe after the war, and to high-debt countries in Latin America during the 1980s debt crisis.
The value of China-led infrastructure projects and other transactions in Asia, Africa, and Latin America, reached $962bn in 2021, with about $573bn in construction contracts and $389bn in nonfinancial investments, according to the Green Finance & Development Center in Shanghai (2023). Indicators on restructured loans vary. Rhodium Group estimates the total value of renegotiated Chinese loans increased to $52bn in 2020-2021, more than 3 times the $16bn of 2018-2019, reaching a total of $ 101bn since 2001. Whereas in 2010 only 5 per cent of China’s overseas lending portfolio supported borrowers in financial distress, this increased to 60 per cent in 2023. According to a report published in March 2023 by AidData, the World Bank, Harvard Kennedy School, and the Kiel Institute for the World Economy, China has issued 128 emergency rescue loans for $240bn to 22 countries. Nearly 80 per cent of these loans were made between 2016 and 2021. Chinese interest rates for rescue loans are on average at 5 per cent, compared to IMF interest rates at about 2 per cent for non-concessional lending. Although trade relations between China and Africa continue to grow, and reached a record high of US 282bn in 2022 according to Construct Africa, loan commitments by China’s trade policy banks fell to a 13-year low of $3.7bn in 2021, with the Chinese government curtailing funding to large-scale oil projects, according to Boston University’s Global Development Policy Center.
World’s Largest Bilateral Lender
With public debt levels surging around the globe, China has become the world’s largest bilateral lender. China EximBank and China Development Bank made $498bn in global loan commitments between 2008-2021 as part of China’s Belt and Road Initiative. General purpose lending to state-owned oil companies in Angola, Brazil, Equador, Russia and Venezuela, reached $60bn between 2009-2017.
Chinese lending became less focused on petroleum producers from 2017 onwards, and the average size of loan commitments dropped from $534m between 2013-2017, to $378m from 2018-2021. Russia was the top recipient with $58bn in loans between 2008-2017, followed by Venezuela with $55bn for extraction and pipeline projects. Lending to Venezuela was halted in 2015, 2 years before Venezuela defaulted on its overseas debt. Angola was the third largest recipient with $33bn for projects in transport, agriculture, water, and oil.
China exceeds other governments as the largest lender to emerging economies, and has become the world’s largest official creditor of emerging economies, surpassing the World Bank, IMF and Paris Club combined. Its bilateral, transaction-based development finance program differs from the Western model of multilateral assistance and debt relief with borrowing countries. Most debt relief is provided by rescheduling debt terms, grace periods, or interest reductions, and less by haircuts on the total value of loans. Yellen commented in April 2023, “I am very, very concerned about some of the activities that China engages in globally, investing in countries in ways that leave them trapped in debt and don’t promote economic development”. China has rejected these claims, arguing that its financing of projects has been central to the economic development of regions in Africa, and has stated that “it has been the private sector, consisting mainly of bondholders in the United States and Europe, that often owns more debt than China does in emerging economies”.
Others beg to differ. Geostrategist Brahma Chellaney wrote in 2018 in Nikkei Asia that Beijing, after establishing a growing presence in the South China Sea, was determined to extend its influence into the Indian Ocean, from Djibouti to Sri Lanka, not least in countries surrounding India, its regional strategic rival. Referring to US President John Adams (1797-1801), who declared, “There are two ways to conquer and enslave a country, one is by the sword, the other is by debt”, Chellaney singled out heavily indebted Maldives, an island in the Indian Ocean, which owed $1.5bn to $2bn to China, equivalent to 80 per cent of Maldives total foreign debt, and referred to the Chinese interest in naval-type port projects in Maldives, as well as in Colombo and Kyaukpyu. Other commentators have made mention of the small fishing village of Mlingotini, and of Bagamoyo in Tanzania, that, once notorious key staging points in the slave trade, are destined to become a $10bn Chinese-built mega port in Africa. Senior officals in the US have regularly warned emerging economies, particularly in Africa, against the dangers of Chinese loans. A US State Department document published in 2020, titled “The Elements of the China Challenge”, referred to Chinese overseas lending as China’s “predatory development program and debt-trap diplomacy”.
There are no international laws that govern when a country defaults on its debt, unlike the legal processes that businesses and individuals in debt can rely on in most countries. Yet the rules of the game are clear. Countries default, and creditors need to get repaid.
The solution does not come easy. When China started its lending under the Road and Belt Initiative program, they were almost immediately followed into riskier markets by private bondholders from developed countries looking for higher returns outside the very low interest rate environment in developed countries following the Global Financial Crisis. This group of creditors is now sharing in the maladie of unforgiving debt surges in markets that once seemed booming with opportunity. In reality, emerging economies experience cyclicality in capital inflows and outflows, sudden stops, and flow reversals as they are notoriously exposed to global financial markets conditions, such as global monetary tightening, exogenous US monetary policy shocks, deterioration in economic activity, and changes in risk perception.
China’s total loan portfolio to countries in distress, defined as (i) countries in arrears, (ii) restructuring their debts with China, (iii) participating in the World Bank’s Debt Service Suspension Initiative, or (iv) at war, increased from 5 per cent in 2010 to 60 per cent in 2022. A pullback in Chinese lending is certain to increase, if not explode, default risks and default associated risks in emerging economies. Although Chinese banks have the capacity to aborb eventual losses on overseas portfolios, China, as a lender, represents a variety of state-owned banks and institutions with differing policies with regard to loan restructuring and loan cancellation, which makes restructuring more complex. In addition, China’s slowed domestic economy, its collapsed real estate sector, and unsustainable high levels of domestic debt, have turned Beijing’s focus more inward.
On Knife Edge
The 350m Lotus Tower in Sri Lanka’s capital Colombo, looming large over the city and one of the tallest buildings in South Asia, had been, together with Hambantota Port and Mattala Rajapaksa International Airport, hailed as symbol of a promising future for the collaboration between China and Sri Lanka. Instead construction suffered delays, and accusations of corruption abounded. Today the tower’s shopping mall, restaurants, and convention center remain either unfinished or unused, and protests against government mismanagement continue in the streets of Colombo.
Hambantota lies at the southern tip of Sri Lanka, a few nautical miles from the Indian Ocean shipping lane that accounts for nearly all of the ocean-borne trade between Asia and Europe, and for more than 80 per cent of ocean-borne global trade. When a Chinese company seized the contract to build the city’s new port, after the Canadian International Development Agency had financed Canada’s leading construction firm SNC-Lavalin to carry out a feasibility report for the port construction, Sri Lanka’s government landed itself in a hotbed of geopolitical competition.
In 2007, China’s Eximbank agreed to fund the construction of the new port by China Harbor Group with a $307m, 15-year commercial loan with a 4 year grace period, and a 6.3 per cent fixed interest/Libor-based floating interest rate, the latter after the US and India had rejected requests from Sri Lanka’s government for financial support for the Hambantota construction. In 2012, when Hambantota was losing money, Sri Lanka borrowed another $757m from China’s Eximbank at a reduced interest rate of 2 per cent. In 2014, Sri Lanka signed an agreement with China Harbor and China Merchant Group for the development and operation of the port for 35 years. China Merchant Group was already operating a new terminal in the port in Colombo, and China Harbor had invested $1.4bn in Colombo Port City, a lucrative real estate development. In 2017, the port was leased to China based on a 65 per cent stake in the port for 35 years, alarming India and the West, and fuelling concerns that the port could be used by China as a naval base.
Massive international lending to projects with little economic benefits, including for expensive cricket stadiums (sic), have brought Sri Lanka little in terms of GDP add-value. Yet the roots of the economic crisis go deeper than China’s lending policies. Callous domestic political decisions in past decades have pushed the island into a sequence of balance of payment crises and exponential rises in foreign debt. For decades, government expenditure, including military spending, fertilizer bans, and erratic tax policies, aggravated the debt situation. After the opposition won the elections in 2015, and Maithripala Sirisena took office, the country almost immediately turned into financial dire straits, being unable to finance payments on its international sovereign bonds, comprising nearly 40 per cent of Sri Lanka’s external debt. However, when Sirisena took office, Sri Lanka owed more to Japan, the World Bank, and the Asian Development Bank than to China. Of the $4.5bn in public debt Sri Lanka would settle in 2017, only 5 per cent related to Hambantota.
As in the case of Sri Lanka, which defaulted on its public debt in May 2022, debt distress is high in many emerging economies, including Pakistan, Argentina, Ghana, Belarus, Egypt, Mongolia, Nigeria, Turkey, Kenya, Zambia, and Djibouti, resulting in China providing “rescue loans” for faltering loans issued for the construction of roads, airports, railways, ports, and other infrastructure projects, to prevent payment crises and sovereign credit rating downgrades. Each of these countries has a credit rating of “junk” from Moody’s and S&P, meaning that the risk of default on their debt is significant. Pakistan, the biggest single recipient of China’s Belt and Road program, with a total of $65bn in Chinese finance pledges, became notorious for its $46bn port city development project in Gwadar, known as “the jewel of the China-Pakistan Economic Corridor”, located on the Arabian Sea, at the strategically important mouth of the Strait of Hormuz, a project initially mothballed for years. Pakistan’s current foreign exchange reserves were at their lowest level since 2014, covering less than 2 month’s worth of the cost of imports, yet another case on knife edge. In June 2023 the country secured a tentative $3bn financing arrangement with the IMF, promising Pakistan potential, short-term relief.
The largest problems with Belt and Road Initiative’s loans concentrate in SubSaharan Africa, where, according to the Rhodium Group, $101bn in Chinese debt had to be renegotiated since 2001, compared to $21bn in East Asia & Pacific, and $12bn in Latin America and the Caribbean. A major recipient of Chinese loans is Zambia, which defaulted in 2020 on its external debt. China is Zambia’s largest bilateral lender, representing $6bn of the country’s $17bn in external debt. Lusaka, once presented as a star of the Belt and Road Initiative on the African continent, spent the Chinese loans on a dazzling array of commissioned projects including 2 international airports, a large hydropower dam, a railway connecting the country to Tanzania, 2 sports stadiums, and a hospital, before it went into default.
China’s Debt Trap
The debt-trap narrative implies that Chinese lenders have ulterior motives, by deliberately lending to countries when they know these countries cannot repay. Like private bondholders based in developed countries, which own a large part of Africa’s debt, China has provided loans to countries that looked promising. All of these creditors, including China, have in recent years realized that risk profiles can shift dramatically in a very short period of time.
Fears of shifts in Chinese geopolitical and economic influence have amplified the debt trap narrative. The criticism is often as incorrect as it is unrealistic. Debt trap allegations have infuriated China, which has been quick to point out that Western private lenders own large parts of the debt of emerging economies and charge higher interest rates. According to Brautigam and Hameri, there is scant evidence of debt trap diplomacy or asset seizures, while the growth in sovereign bonds owned by investors in developed economies heavily contributes to African countries’ debt.
In the case of Africa, other factors play their part. Africa is home to some of the fastest growing economies in the world, with an abundance of natural resources and burgeoning demographic consumer markets in the waiting. Yet the African continent continues to represent less than a footnote to many international investors. I recall traveling in Algeria from the capital of Algiers to Constantine, witnessing railway and road works by Chinese and Turkish contractors, and staying overnight at the Marriott in Constantine, one of the world’s oldest cities famous for its bridges, which hotel construction had been completed by a Chinese contractor, as has been the case with other real estate and infrastructure projects in Africa. Traveling overland by car through Ethiopia a few months later, things did not look much different on the ground, with Chinese billboards stacked everwhere next to ongoing construction projects and road works.
Infrastructure projects in Africa have been, with the assistance of Chinese loans, an effective driver of economic cross-border and regional development. Examples are the 750km railway line from Addis Ababa to Djibouti, cutting the journey from the Ethiopian capital to the port from about 3 days to 12 hours, a new railway line from Mombasa to Nairobi in Kenya, and hydropower dams built by Chinese contractors in Uganda.
Anatomy of Debt
The question then remains: did China overrun emerging economies with its Belt and Road Initiative, in particular in Africa, and how do Chinese loans weigh relative to other creditor classes owning African debt.
Other macroeconomic trends contribute to Africa’s surging debt. Ayhan Kose, head of the World Bank’s forecasting unit, has expressed concern that emerging economies may be headed towards a debt crisis on a scale last seen in the 1980s. Existing public debt levels, dwindling foreign currency reserves, war in Ukraine, tightening global financial conditions, inflation, the slowed growth of China’s economy, and geopolitical competition between the US and China are all contributing to such scenarios.
It is important to understand the anatomy of public debt in Africa. The struggles of Ghana, Sri Lanka, Zambia and other nations on the edge of default are not unprecedented. Previous crises came in the wake of low commodity prices, which are relatively high today. Debt vulnerabilities in low-income countries are less alarming than they were in the 1990s. Yet the debt crises of these emerging economies have spilled over from global financial markets to geopolitics due to the emergence of China. Over the past decades, China and private bondholders became significant lenders to emerging economies. To integrate China and the growing number of private bondholders into the multilateral debt relief process, the G-20 set up the Common Framework, which has not proven to be much of a success. The main reason lies in its design, which requires creditors, including China, to delegate decisions on debt relief to the IMF, and relegates private creditors to the status of residual creditors. Multilateral banks such as the World Bank and Asian Development Bank continue to enjoy a preferred creditor status.
The Kiel Institute for the World Economy, in its excellent Working Paper “Who Lends to Africa and How” published in April 2023, researched 7400 loans and bonds between 2000 and 2002, with a total volume of $790bn, excluding domestic public debt, and focusing on external public bonds and loans with maturities of 1 year or more. Figure 6 shows the scale of Africa’s lending boom since 2000. It shows that the number of newly issued debt instruments doubled between the late 2000s and late 2010s, while the volume of new annual debt commitments increased about fourfold.
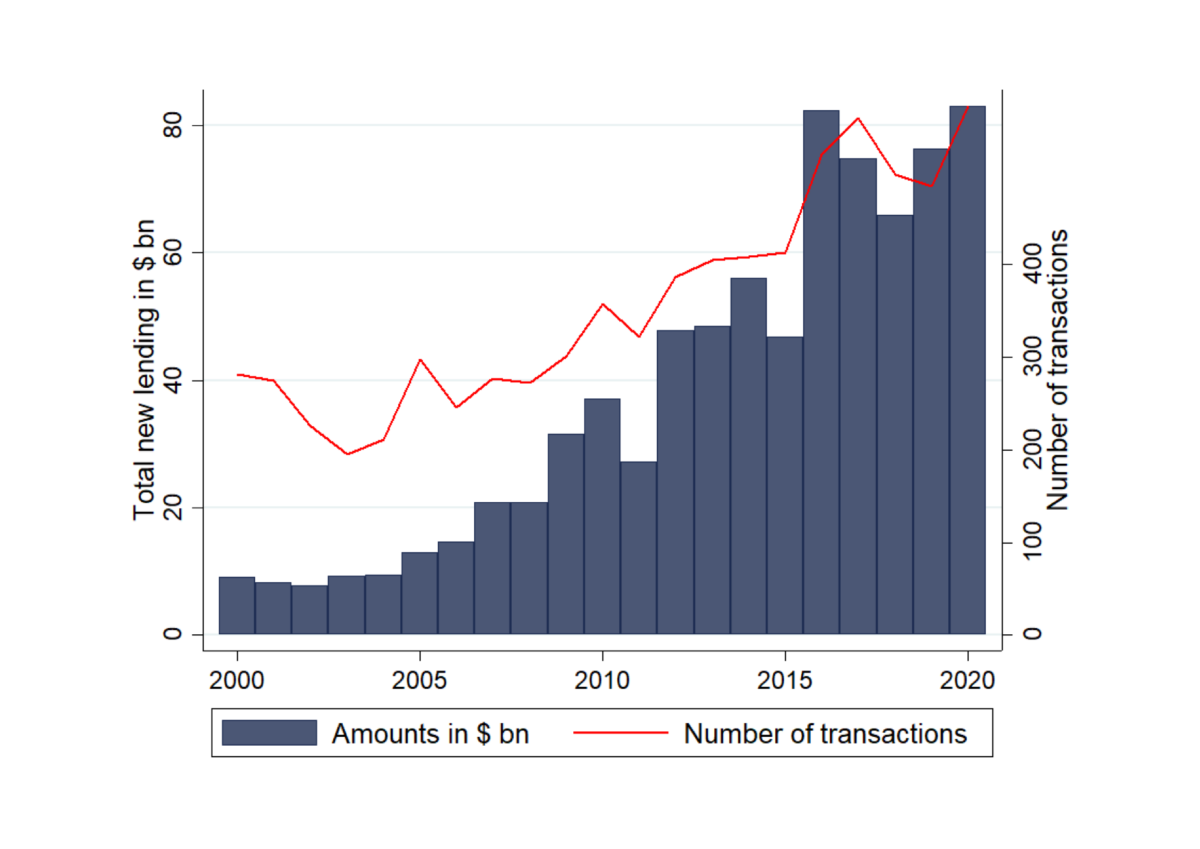
Figure 6. Africa’s debt boom. Source: Kiel Institute for the World Economy (2023).
The Kiel data capture the changing composition of creditors to Africa in the last 2 decades, including the rise in debt from Chinese creditors and of bonded debt, which account for the largest part of the lending boom in Africa since 2010.
In 2020, an increase in multilateral lending and corporate bonds in response to the pandemic occurred (Figure 7). The massive spike in 2015 in bilateral lending was caused by a Russian loan to Egypt for the construction of a new nuclear power plant for $25bn. Bonds account for a substantial portion in total lending to Africa.
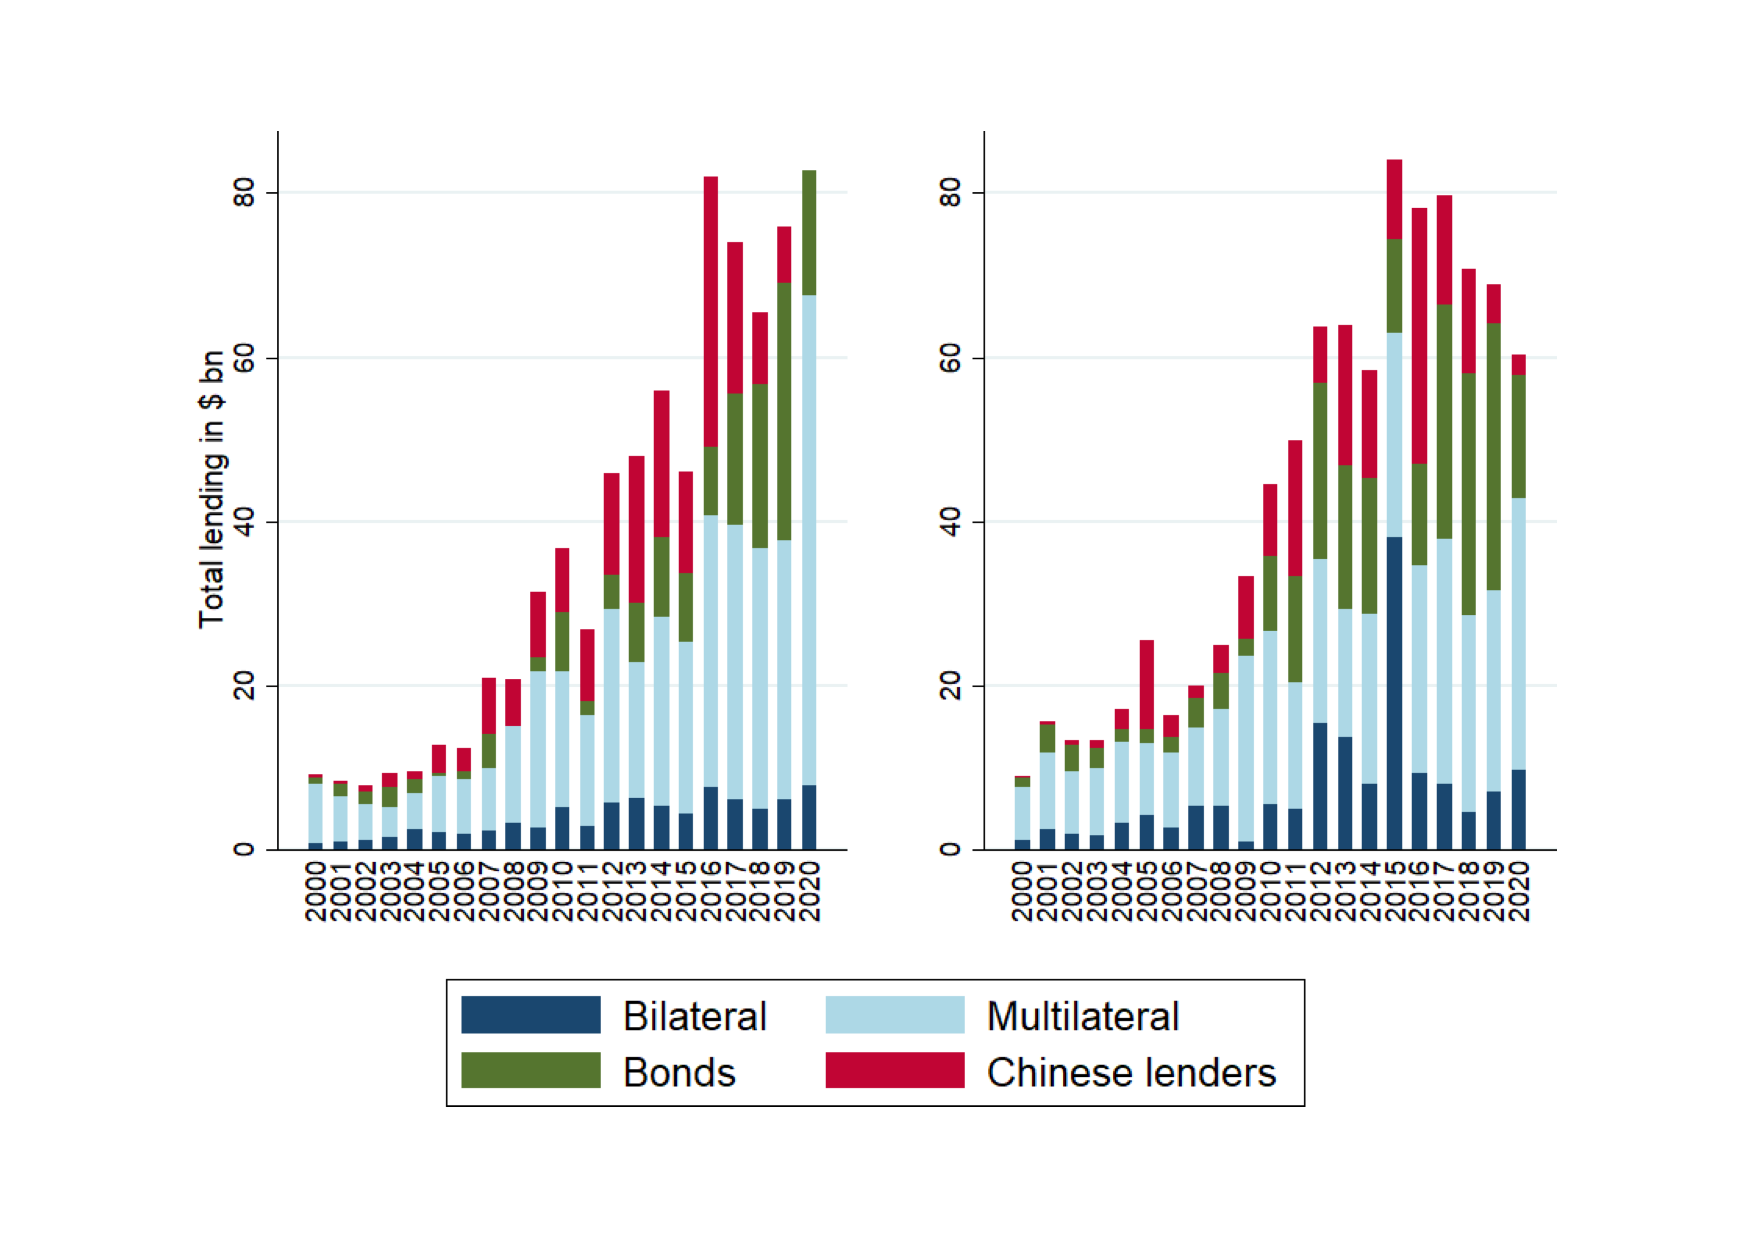
Figure 7. Total lending amounts by creditor category 200-2020. | ADD vs World Bank IDS. Source: Kiel Institute for the World Economy (2023).
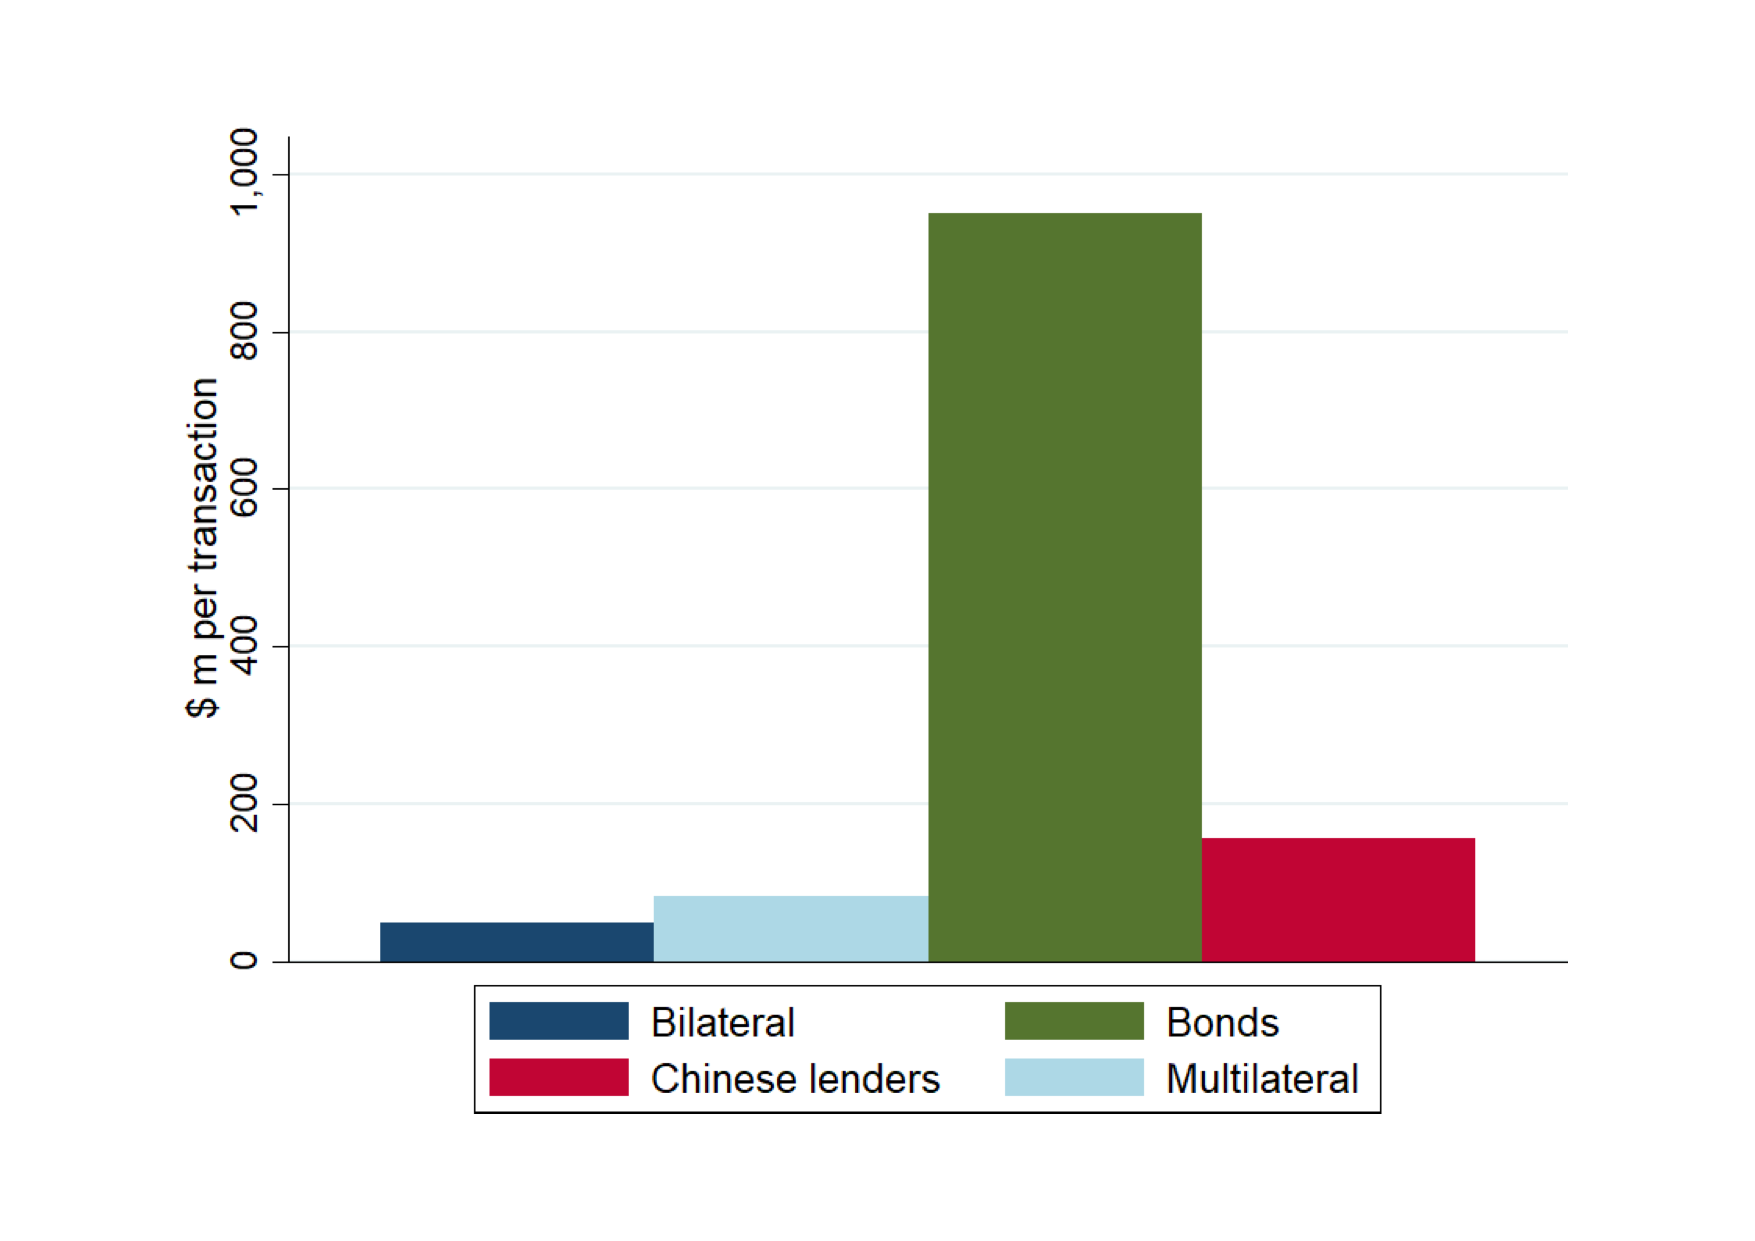
Figure 8. Sovereign bonds issuance vs creditor loans. Source: Kiel Institute for the World Economy (2023).
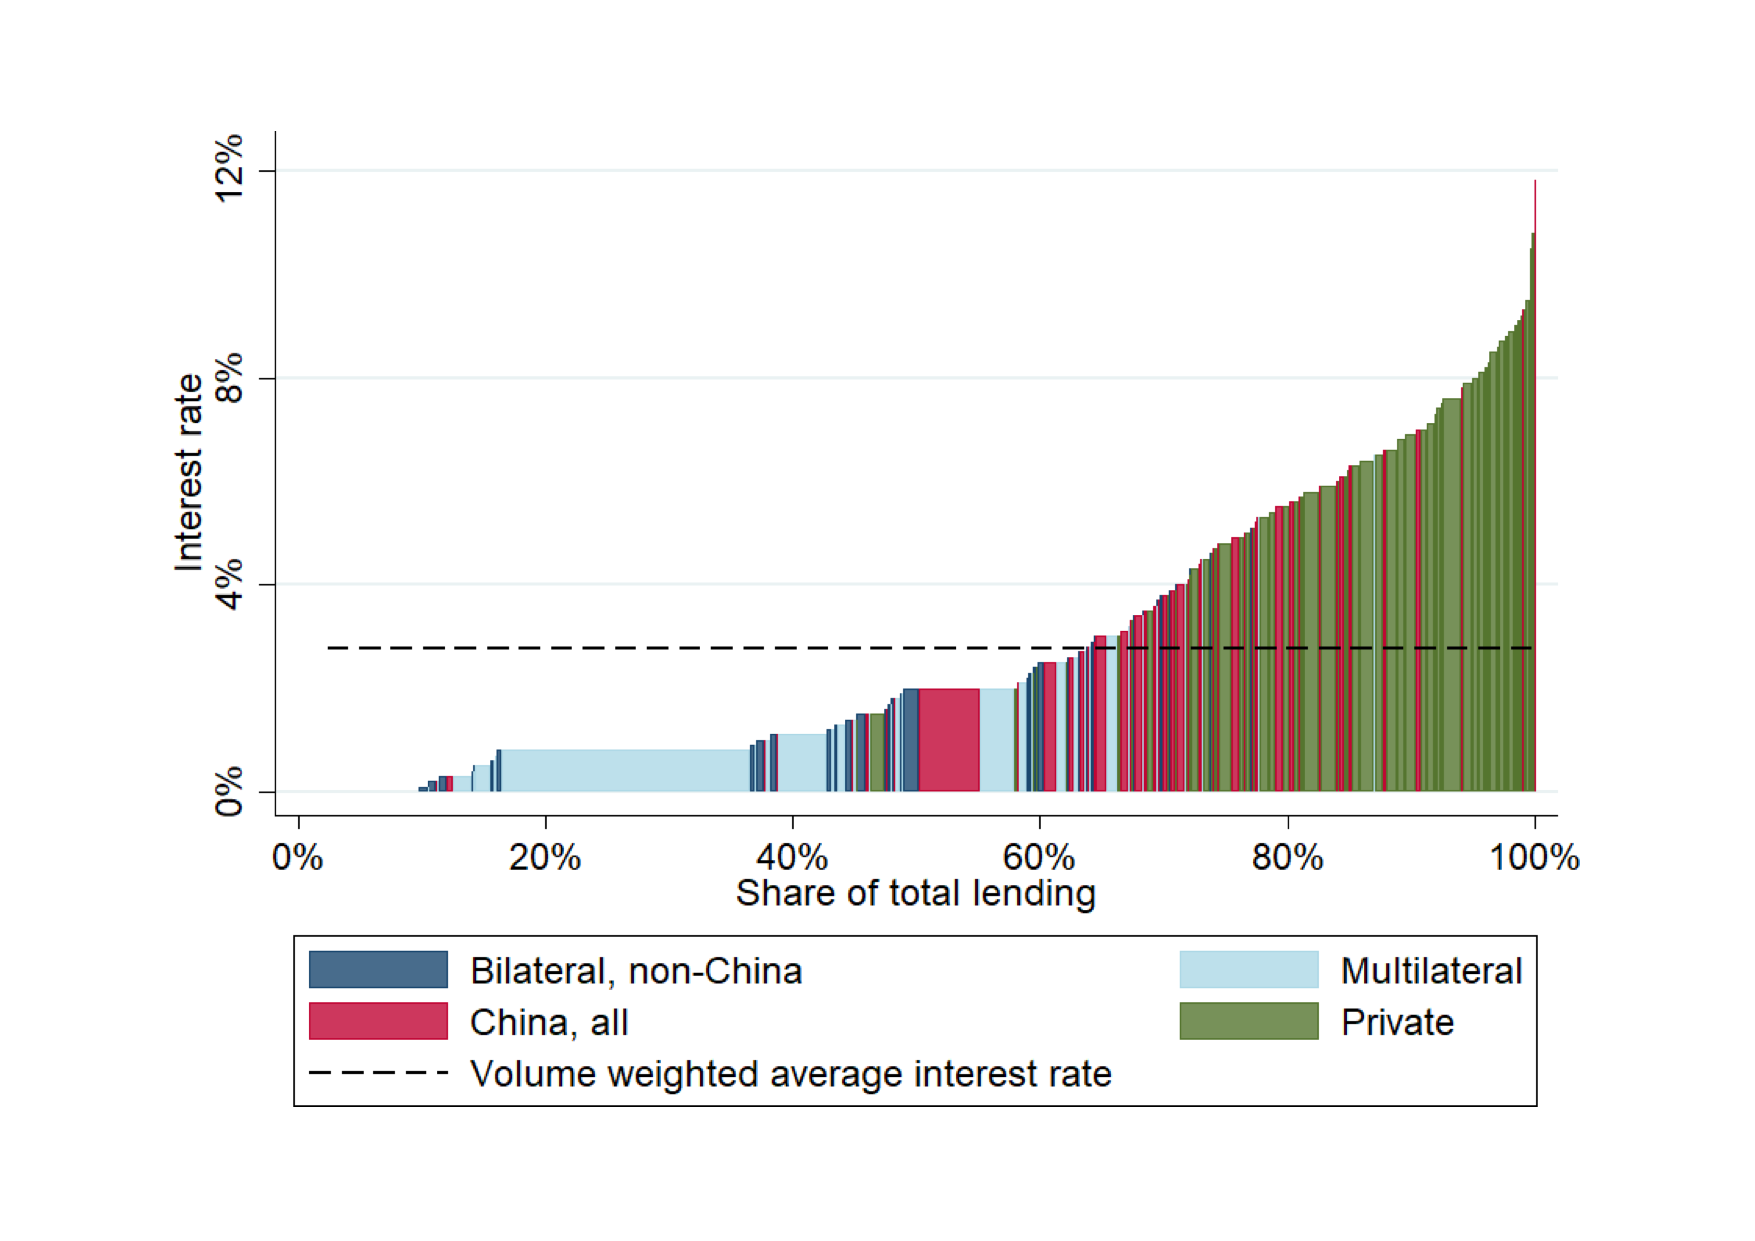
Figure 9. Distribution of interest rates across creditors. Source: Kiel Institute for the World Economy (2023).
Lending rates to Africa vary, with private market loans at an average interest rate of 6 per cent, Chinese loans at 2-4 per cent interest on average, and multinational organizations at about 1 per cent. What is remarkable is that many African governments have borrowed simultaneously from different creditor classes, at vastly different rates.
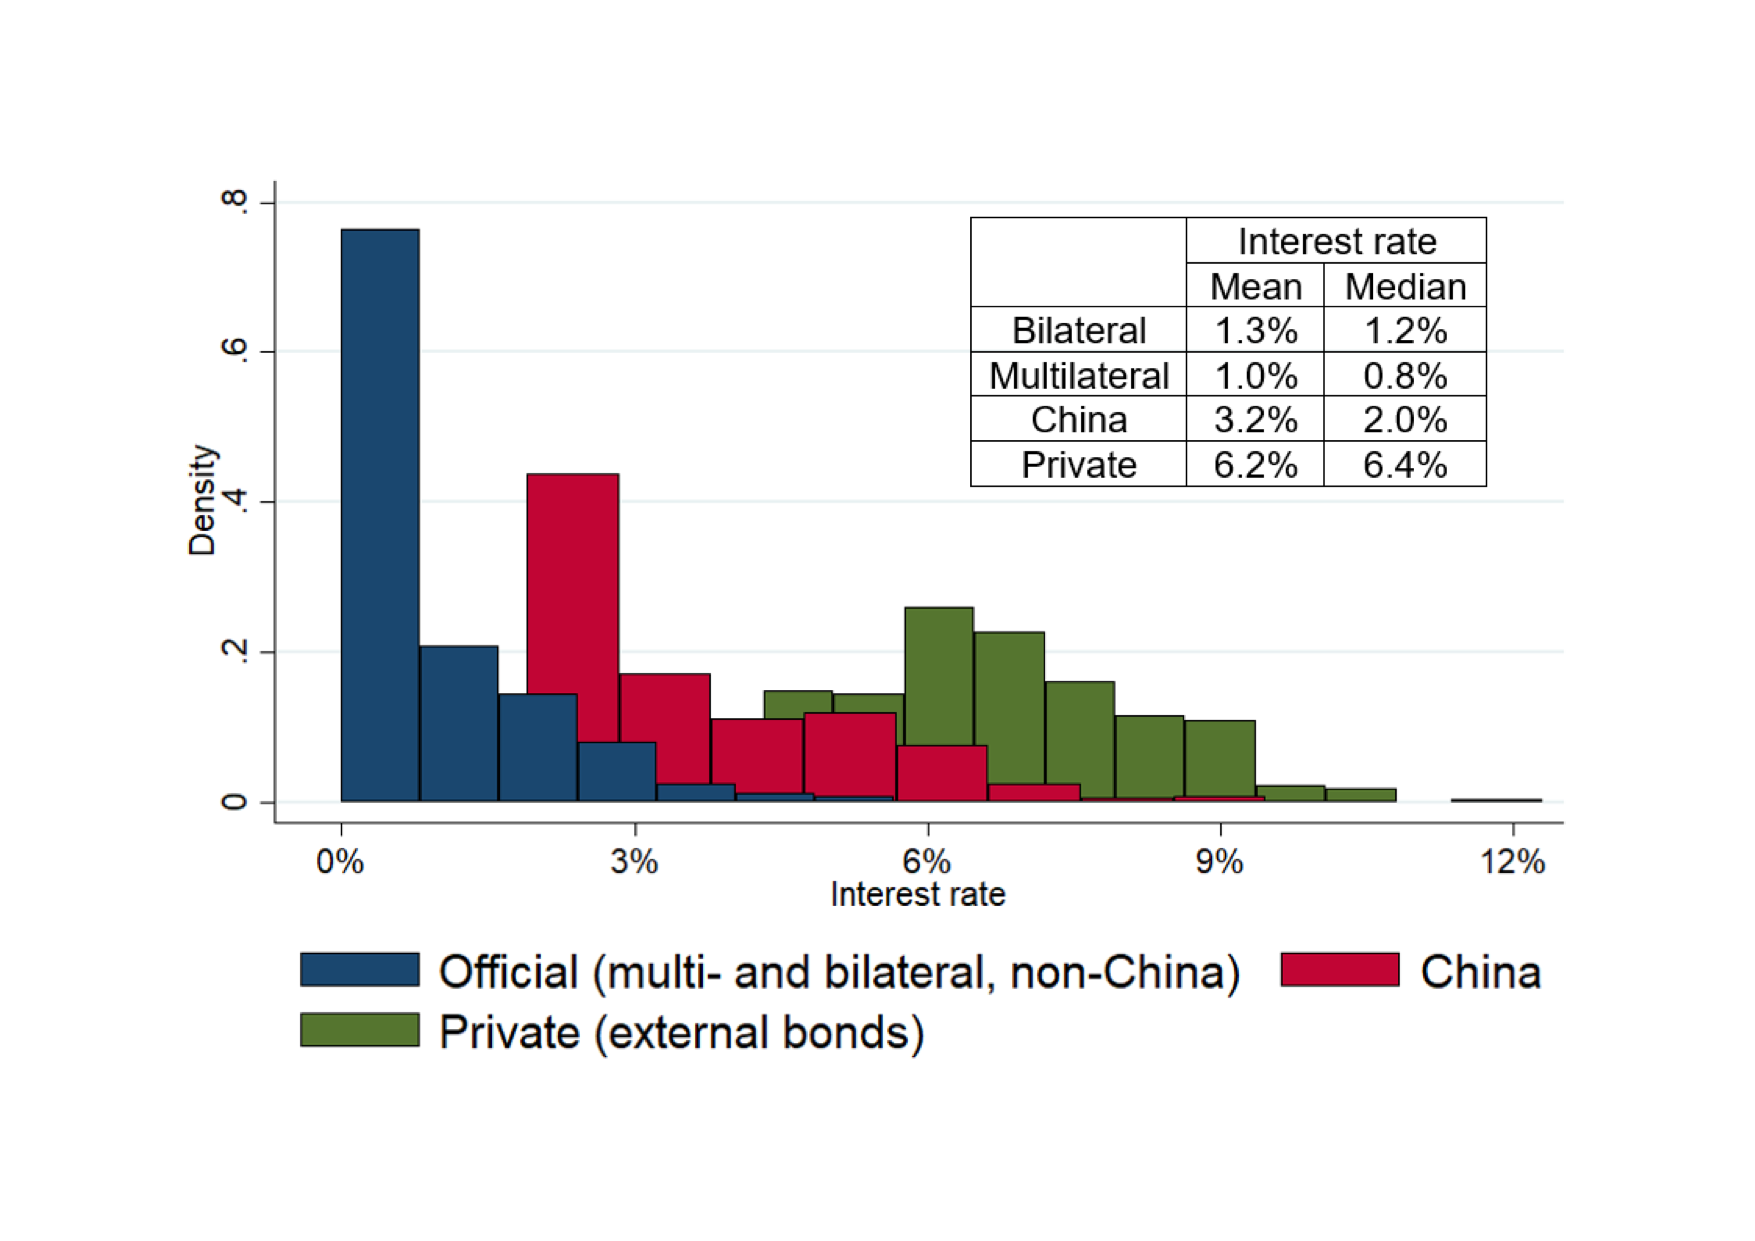
Figure 10. African public debt interest rates distribution across creditor groups. Source: Kiel Institute for the World Economy (2023).
Figure 10 shows the share of total borrowing at any particular interest rate. Bonds are substantially more expensive in comparison to other funding sources, with Chinese loans showing higher rates than other loans but well below bond rates.
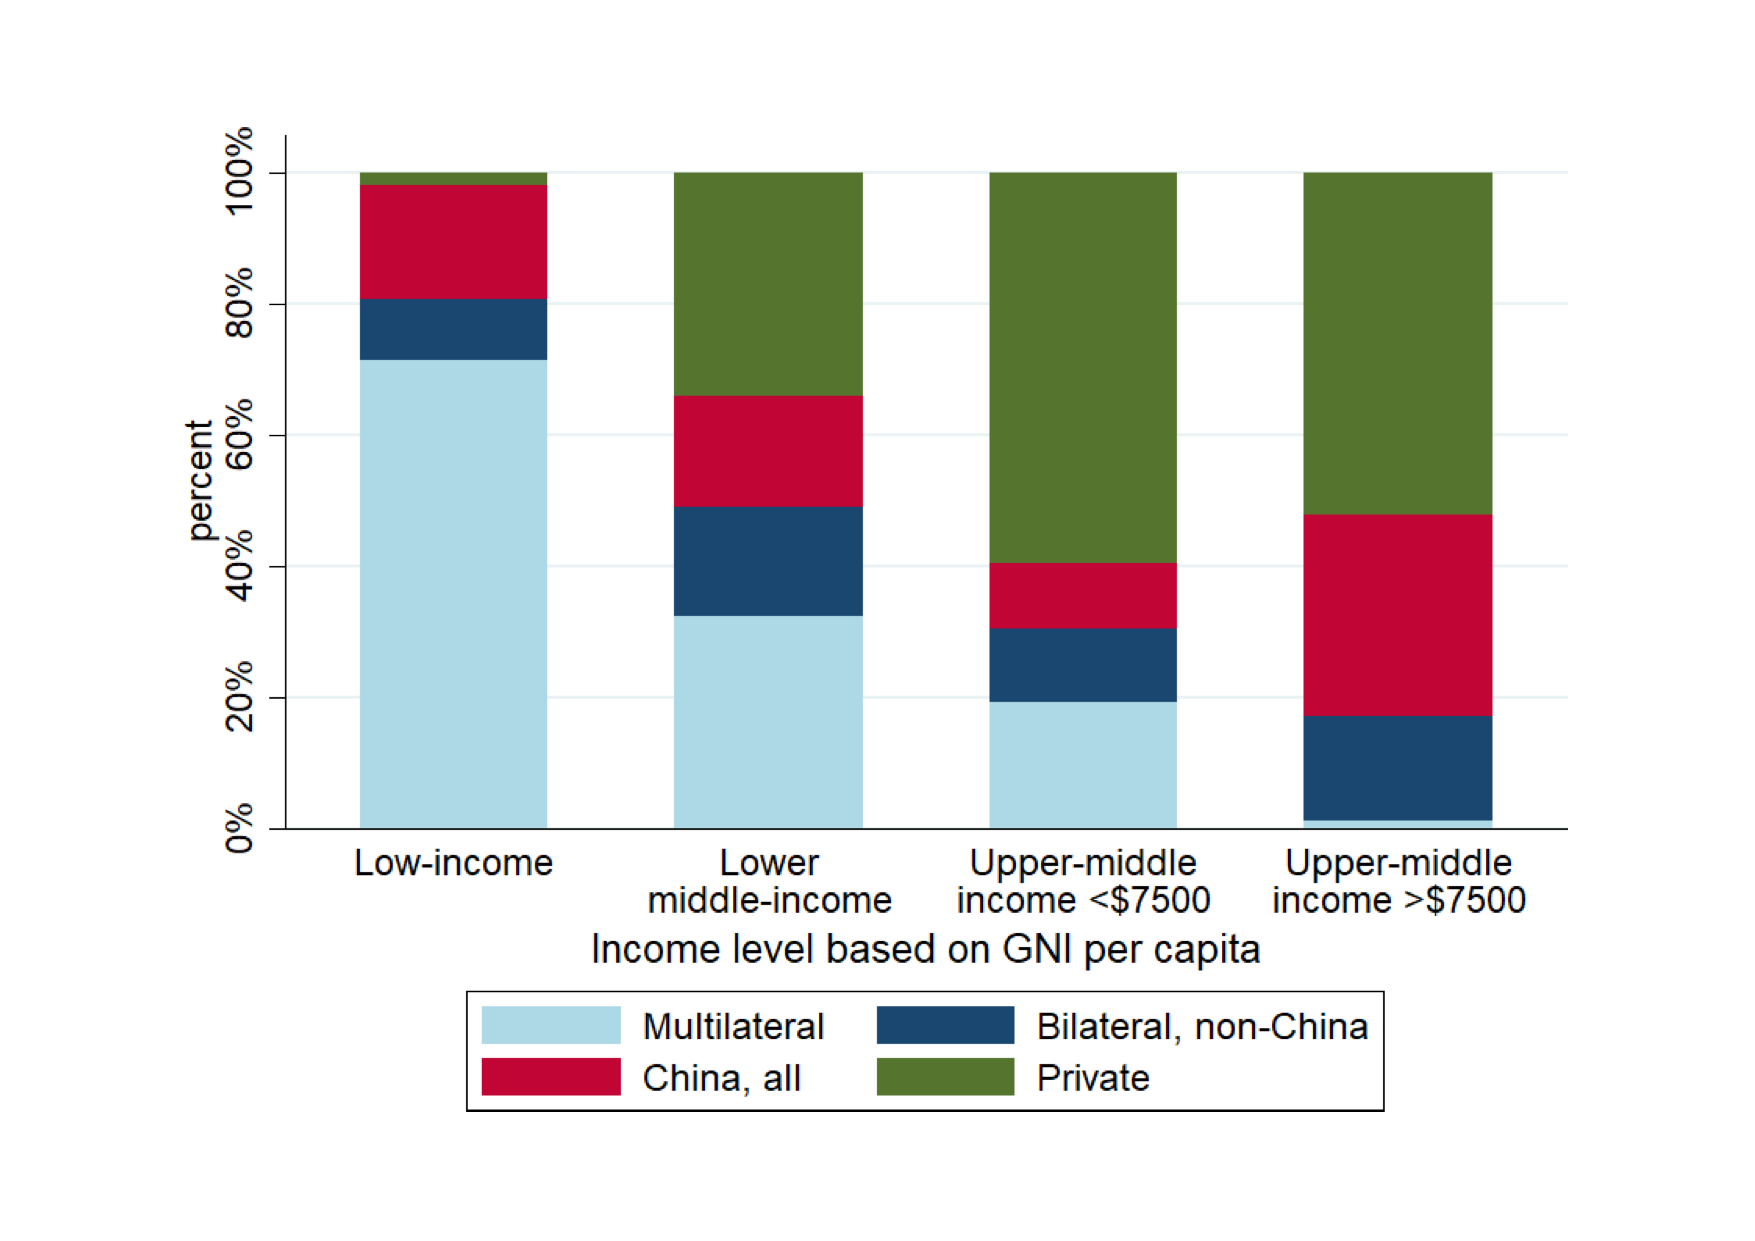
Figure 11. Lending sources African emerging economies. Source: Kiel Institute for the World Economy (2023).
African countries at the bottom of the income distribution rely heavily on loans from multilateral agencies, whereas the richest African countries use primarily private borrowing. A majority of the continent’s countries use both cheap and expensive credit at the same time.
The Kiel data reveal facts previously unknown on Africa’s public debt universe. The most compelling insight is the fact that China, other than representing a debt trap, has contributed to the growing public debt levels in Africa proportionate to other creditors, and has decreased its loan commitments to the African continent in recent years.
The second revelation is the large dispersion in creditor categories and borrowing terms amongst creditors. Many African countries borrow heavily from mulilateral agencies at low interest rates, while tapping into international bond markets at interest rates of 7 per cent or even 10 per cent. The large differences in service costs reveal a cross-creditor subsidy effect, as cheap taxpayers financed government- and multilateral loans and guarantees are used to service expensive bonds held by US and European equity investors and hedge funds.
In its 14th Five-Year Plan for 2021-2025, the Chinese Ministry of Commerce planned for China to invest $550bn, including spending in non-Belt and Road Initiative countries, down 25 per cent from the 2016-2020 period. AidData captured 13,427 Chines projects across 165 countries over an 18-years period and found that 35 per cent of Road and Belt Initiative infrastructure projects have encountered implementation problems. Large projects within the transport sector attracted the most backlash. In 2018, Malaysia was forced to suspend Phase 1 of the China EximBank-financed East Coast Rail Link Project due to concerns of overpricing and corruption. The railway connects Port Klang to the populous Peninsular Malaysia. The project was reinstated in 2019 after Malaysia renegotiated the terms of the project with China Communications Construction Company (CCCC), the state-owned infrastructure contractor that spearheads many Road and Belt Initiative projects.
Nigeria announced in July 2022 that it was turning to Standard Chartered Bank to fund $3bn for the Port Harcourt-Maiduguri railway project, following lending delays with China’s EximBank. Recently Kerata Cepat Indonesia China, which is 40 per cent owned by Chinese companies, proposed to add another 30 years to its 50-year concession of a high-speed railway under construction in Java. Delays have forced the Indonesian government to pay an additional $468m in construction costs to prevent relinquishment of ownership in the railway, as part of an 80-years concession to China. The Belt and Road Initiative retreat has been felt in Europe as well, prompted by national security concerns on China’s geopolitical ambitions. Romania, Lithuania, Slovenia, and Croatia have suspended public tenders involving Chinese companies, with Croatia in 2021 cancelling a $3bn agreement to commission Rijeka Port to a consortium of 3 Chinese contractors.
Africa | An Emerging Asset Class
It is a well-known expression. When the world sneezes, Africa catches a cold. Several commentators have made reference to “Africa’s new permacrisis”, in view of the continent’s high exposure to public debt, with African countries paying $68.9bn in debt service in 2023 (AidData, 2023).
Yet on the ground a different, parallel narrative runs its course. A frantic focus has emerged amongst African governments and businesses, driving initiatives to unlock and integrate regional economic markets by harmonizing investment policies, development of transport and free trade zones, logistics, and industrial warehousing. Young financial advisers and entrepreneurs, graduated from US and other foreign universities, return home, determined to set-up successful businesses in their countries of origin. African tech start-ups raised $5.2bn in 2021 (FT, May 2023). Abuja-based AFEX Commodities Exchange, which provides brokerage and trade finance services for commodities, shows a compound annual growth rate over 3 years of more than 500 per cent, driven by the huge cohort of Nigeria’s 223.8m population, with a median age of 18 years, who are beginning to consume goods and services for the first time. Nairobi, a runner-up regional financial center, rose to position 103 in the Global Financial Centres Index (GFCI) of 2023. Casablanca (57) remained the leading financial center in Africa, followed by Johannesburg (69), Cape Town (73), Mauritius (81), and Kigali (98), another runner-up.
Africa’s pre pandemic top performing economies, Benin, Côte d’Ivoire, Ethiopia, Rwanda, and Tanzania are projected to return to the league of the world’s 10 fastest growing economies in 2023-2024. Development is anticipated to be slower, as private lenders are focusing their exposure on the larger and strongest businesses. Well positioned and capitalized promoters in Africa continue to receive lender support. Inefficient markets, mispriced assets, unrealistic corporate budgets, corruption, and the astounding refusal amongst some business owners to accept professional standards, will fall out of favor in the decades ahead. Despite the hurdles, illiquidity, and delays investors in Africa experience, investing in African sectoral and regional markets has potential to generate bankable projects with a strong upside, and we are continously sourcing these projects.
Most African companies are outside the scope of mutual funds and institutional investors, and fall within alternative asset classes suitable for private equity investors who may commit to 5 to 10 year investment terms, without short-term pressure to redeem, in exchange for above-average returns in alternative asset classes. This “higher risk, higher return” profile also explains the high level of foreign private ownership of debt in Africa.
To return to the question, where does Africa stand with the often narrated “China’s debt trap”? Foreign debt in Africa increased more than fivefold between 2000 and 2021. Of the overall foreign debt in Africa, China owns 12 per cent, compared to 35 per cent owned to private creditors (excluding Chinese private creditors), and 39 per cent to multilateral institutions. Debt owned by African countries is equivalent to 24 per cent of their combined GDP in 2021, and the average cost of servicing foreign debt today consumes 17 per cent of African governments’ revenues, a record since 1999.
Notes on China | Growing Challenges
China’s global footprint has grown rapidly in the past decade, with the country’s total banking assets at $54tn in 2021, the largest in the world, tripling in size over the past 10 years. The top 4 commercial banks globally measured by assets are from China. Even at a slowed pace, the Chinese banking system is expected to surpass the size of the US and European banking systems combined by 2030.
One of the main drivers of the slowed economic growth in China is the unwinding of an unprecedented credit bubble in the country’s financial system. China’s economy depends on investment, which depends heavily on the flow of new credit. Investment makes up approx 42 per cent of China’s GDP. In the past, China’s financial system grew much faster than its real economy; credit increased by an average 18 per cent per year between 2007 and 2016, and the banking system added $26.8tn in assets over that period, compared to $7.6tn in GDP growth. Credit expanded rapidly because of government guarantees for both lenders and borrowers. This resulted in a dramatic expansion of China’s banking system, which extended large volumes of credit to real estate developers and local governments, and was a core part of the Chinese strategy for expanding the economy. China’s financial system no longer generates the same credit growth; the upper limit for credit growth is projected at 12 per cent; for most years, it is expected to be less.
While other countries are fighting inflation, China is teetering on the brink of consumer deflation. Although China’s economy is growing, with a targeted GDP growth of 5 per cent for 2023, the post pandemic recovery has been fragile. Overall credit demand in China has weakened, and short-term (1M and 3M) bill financing rates have plummeted close to zero in recent months. In June 2023, the consumer index was flat YOY, while factory gate prices fell at the fastest pace since 2016, as demand for consumer products softened. The producer price index declined with 5.4 per cent YOY. Analysts expect China’s central bank to reduce interest rates, adding to earlier cuts.
The US House of Representatives recently voted unanimously that China should no longer be considered a “developing country”, a decision mainly motivated to deny China the preferential treatment it receives as a developing country under the World Trade Organization, United Nations Climate Framework, and other international arrangements.
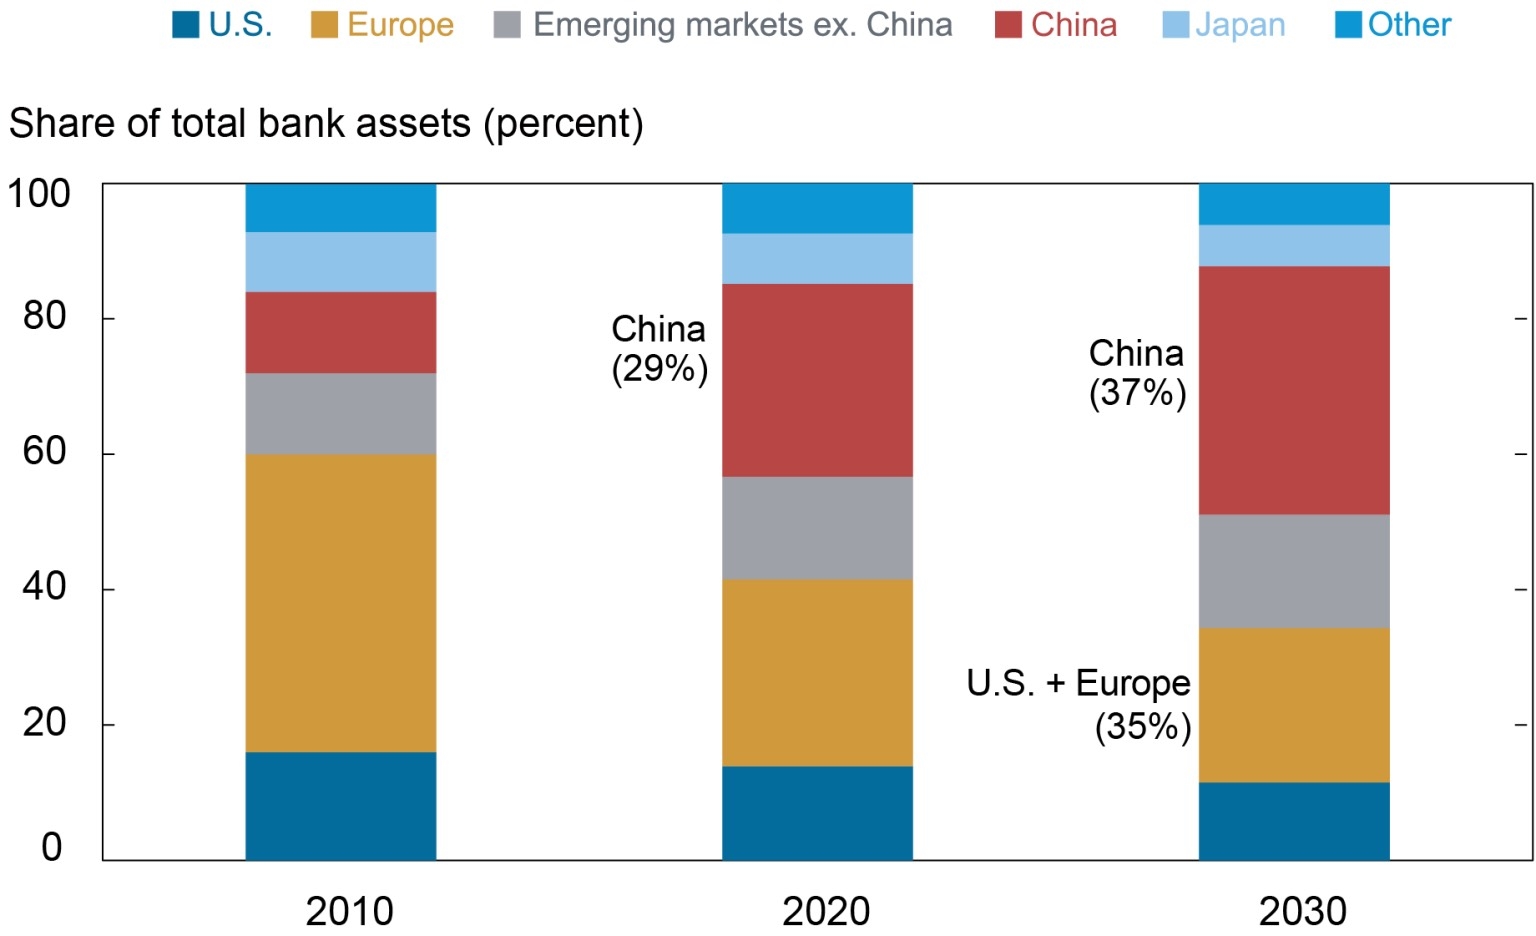
Figure 12. Total bank assets China 2010-2020. Source: J. Dawson, A Closer Look at Chinese Overseas Lending, Federal Reserve Bank New York, Liberty Street Economics (November 2022).
Is China a rich global power as many policy makers seem to believe, or is the nation still trapped in the problems of a developing economy? China accounts for 50 per cent of the growth in global wealth for 2000-2020, followed by the US at 22 per cent. During the same period, China accounted for 26 per cent of the growth in GDP, while the US contributed 21 per cent.
The most probable answer to the question is: both. China has successfully transformed itself from a low-income country in the 1990s into the world’s second-largest economy, and acts as a global power, projecting its economic and diplomatic influence abroad. Chinese stock markets are about $ 10-15tn in size, equal to 70 percent of the Chinese economy, against US stock markets at $50-60tn, equal in size to about 250 per cent of the US economy, and 4 times the size of the Chinese economy (ignoring the extent of potential overvaluation for both markets). The size of the US real estate market is estimated at $30-35tn, while some sources claim Chinese residential and commercial real estate is estimated at $80-85tn, a number that is likely to be heavily overvalued, given the differences in GDP between both countries, about $26.24tn for the US, and $19.37tn for China. If China’s real estate valuations reflect fictitious wealth creation relative to the differences in GDP between the US and China, this poses a huge problem, considering that real estate represents about 60 per cent of household wealth in China.
The country still has many characteristics of a developing economy, including a population of more than 200 million people without access to clean cooking technologies, widespread pollution, heavy reliance on coal, shrinking foreign currency reserves, climate change challenges with sea level rises in its coastal provinces (where hundreds of millions of citizens live), an ageing population, and a scoring on the Human Development Index of 79th out of 191 countries, falling behind Sri Lanka and Iran. Although China is expected to soon break through the “middle income trap” to “high income” under the World Bank country classification system, something that is likely to have supported the US House vote, the International Energy Agency (IEA) has estimated that it will take China to 2030 to provide basic clean cooking access to all its citizens. It has also projected that China, the world’s largest energy user, will need to procure 20 per cent more energy in 2040, compared to the US, Japan, and Europe, where energy consumption is expected to fall. Much of China’s energy needs will have to be imported, which affects the country’s approach to the Middle East, Iran, and Russsia.
More importantly, China ranks, in $ dollar terms, far behind income levels enjoyed in developed OECD countries, with its GDP per capita being currently half that of Portugal. Where Beijing enjoys GDP per capita levels resembling Europe, households in China poorest region live at GDP of $6,622, similar to a country as Peru. China has yet a long way to go to reach the high-income country threshold of $20,000 per capita income, a feat few other former middle-income countries managed, with the exception of South Korea and some oilproducing countries.
China downsized its Belt and Road Initiative program after the country’s foreign exchange reserves dropped to $3tn from $4tn in 2014. Foreign exchange reserves Chinese financial institutions used to lend to Belt and Road countries were reduced. According to data from China’s State Administration of Foreign Exchange (SAFE), China’s overseas financial assets totaled $9.2tn in June 2022, of which $3.23tn in foreign exchange reserves, the largest FX reserves in the world. While foreign exchange reserves remained stable over the past 5 years, China’s non-reserve overseas assets, including FDI, portfolio investment, and overseas loans, almost quadrupled over the past decade to about $6tn.
Dawson compares the rapid increase in China’s non-reserve overseas assets to developments in Japan in the 1980s-1990s when, during a period ending in 1993, Japan’s non-reserve assets increased from 2 percent of global GDP to 8 per cent. The expansion was driven by large outflows of foreign direct investment and construction companies to developed countries.
Over the past decade China’s non-reserve overseas assets rose to about 6 per cent of global GDP. Chinese state-owned commercial banks have supported extensive outbound FDI by Chinese state-owned enterprises, a large part of which went into Chinese-led infrastructure projects. Both in the case of Japan in the 1980s-1990s and in China, increases in overseas lending account for one third of non-reserve asset growth.
Figure 13 shows that Chinese overseas lending increased to nearly $2tn in June 2022. This includes bank loans, trade credits, and debt claims from China’s FDI, with bank loans and trade credits accounting for most of the total. Chinese banks rank 6th amongst international creditors, according to data from the Bank for International Settlements. China’s overseas bank lending still accounts for only 5 per cent of its total bank assets, whereas cross-border loans are approx. 20 per cent and 24 per cent of total bank assets in the US and Japan.
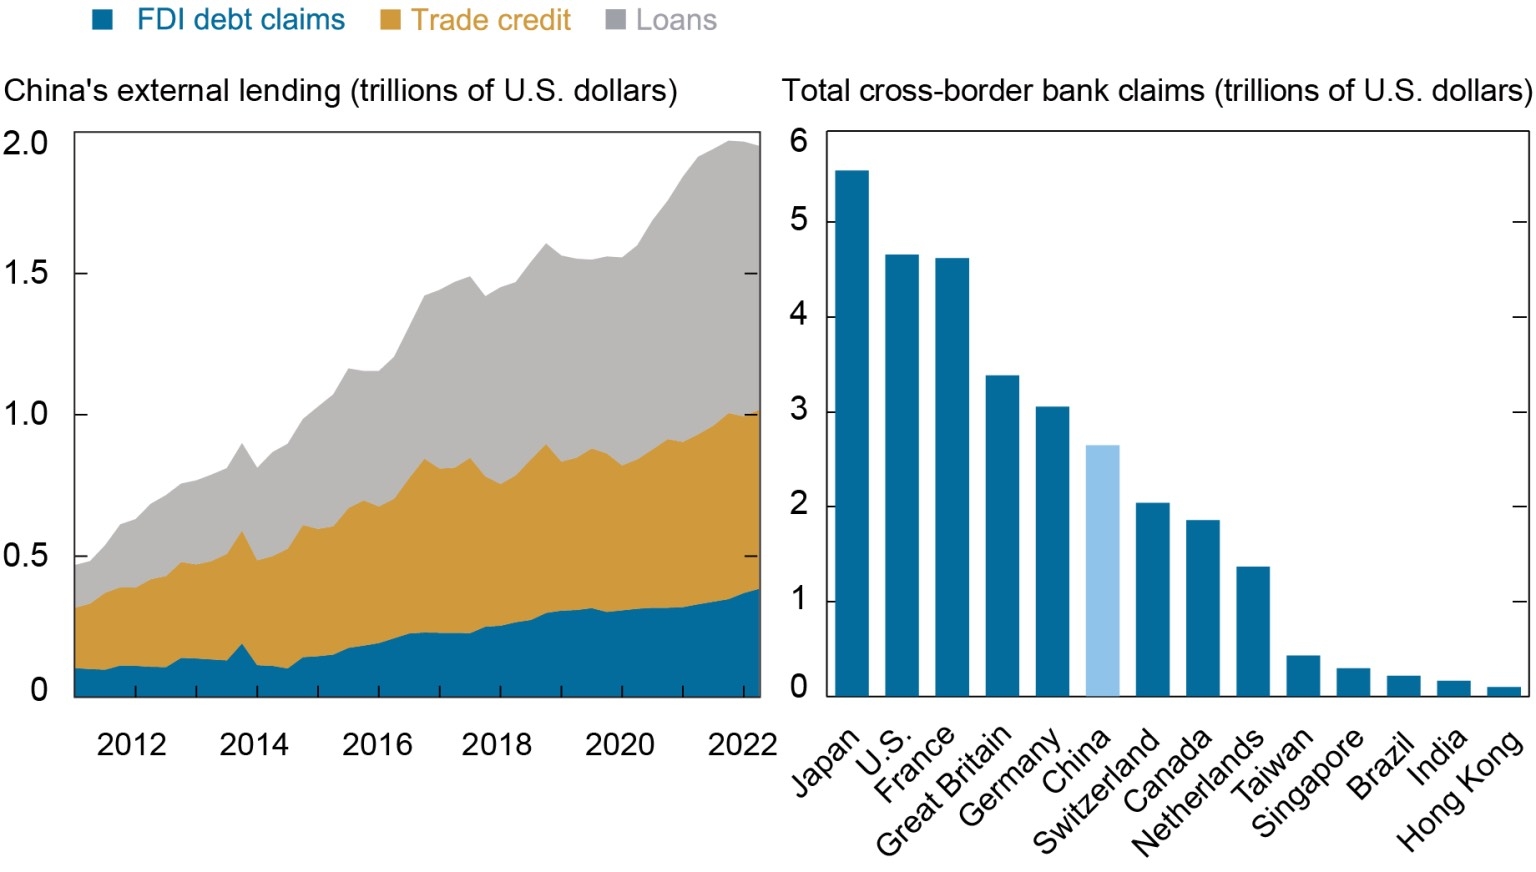
Figure 13. China’s external lending 2012-2020. Source: J.Dawson, A Closer Look at Chinese Overseas Lending. Source: Federal Reserve Bank of New York, Liberty Street Economics (November 2022).
Pressures in China’s local government financing vehicles have mounted in recent years, with debt nearly doubled over the past 5 years to about $9.3tn according to the IMF, equivalent to almost half of China’s annual economic output. Although none of the local governments have defaulted, urgent calls for repayment of loans abound, as was the case in Wuhan in May 2023, where the government did not refrain from openly naming and shaming hundreds of debtors in local newspapers, demanding payment. Many local governments rely on restructuring loans or injections of government cash to stay afloat, a situation that is further aggravated by the slump in the real estate markets, inactivity of cash-strapped developers, and the slowed growth of the Chinese economy. Former Premier Li Keqiang warned earlier in 2023 that regional governments’ debts are a key threat to China’s financial stability. Although the bond market has remained relatively calm, when local financing authorities start to rein in their loans, a vital source of economic stimulus plunges, which will have a downward effect on China’s slowed economy and, as can be anticipated, on the global economy.
The Bermuda Triangle
There has been a buildup of debt for the last 40 years. In the 1970s, public debt was less than 100 per cent of GDP. In 2023, global debt has accumulated into 349 per cent of GDP, 420 per cent of GDP in developed countries, and rising. De facto bankrupt debtors, or financial zombies, were kept afloat in the period between the Global Financial Crisis and the pandemic. Institutions and corporations were bailed out. Central banks purchased junk bonds to prop up corporate sectors, and to protect corporations from becoming “fallen angels”. These interventions opened the way to frozen junk markets, and initiated the departure from ratings-defined capital allocation processes. The number of credit fund managers that started to hold high-yield debt and invest off-benchmark, went up.
Debtors face high debt servicing ratios. Their debt and rollover debt will come to maturity. The increase in debt servicing costs may lead to a severe recession. This time the problems cannot be resolved by easing monetary and credit policy. Next to the high levels of public debt, there are piles of junk bonds, high yields, leveraged loans, collateralized loan obligations, and private debt to consider.
For households and corporations, income is declining, due to falling real wages and reduced corporate profits. On the asset side, a decline in asset prices will occur, impacting on real estate, public equity, private equity, tech stock, SPACS, crypto, and so on. Bond spreads go higher, and the price of bonds falls, due to heightened risks in credit markets. Cash gives a negative return because of inflation. To be bullish on equities against the backdrop of the sharpest interest rate hikes in a generation and quantitative tightening, beats all logic.
To sum up: people and corporations are hit in their income and on the asset side. Those who are highly leveraged, those with mortgages, credit cards, student loans, corporate loans, bonded debt, and so on, undergo a shock to their debt servicing capacity. It is a very toxic cocktail. When large cohorts in society suffer from these problems, a systemic debt crisis will creep into many sectors and households, and will affect many.
There are winners and losers. We need to look at individual P&Ls and balance sheets, and at geographical and technological differentation. Since the 1980s, globalization has created a cohort of invisibles, impoverished blue-collar workers, citizens, and immigrants, residents of combustible, racially divided, banlieus and suburbs in the US and Europe, areas that bear more than a passing resemblance to social abandonment, crime, and poverty. Their numbers increase. Together with the shrinking middle classes in developed countries, these groups constitute volatile, fragmented, angry, and unpredictable electorates. According to Pew Research, the share of US middle class households in the past 50 years, between 1971 and 2021, diminished from 61 per cent to 50 per cent. Concerns are justified about environmental standards. Real estate assets get stranded and their value lost, because of climate change, hurricanes, sea-level rises, droughts, and fires. Analysts anticipate the commercial real state market to drop with 30 to 40 percent. Regional banks can get into trouble, with loan loss reserves exploding, having to pay more for their deposits, while stuck with lower yield assets.
The geopolitical trade blocs of the US and China aim for secure trade rather than free trade. It remains to be seen how this regionalization of trade will affect global trade levels. The Smoot-Hawley Tariff Act of 1930, a law that implemented protectionist trade policies in the US during the Great Depression, raised tariffs on over 20,000 imported goods to provide revenue, and regulated trade with foreign countries. The act prompted retaliatory tariffs by affected states against the US, and caused a trade war that quickly turned global. Although the tariff did not cause the Great Depression, and analysts have pointed out that it was the crunch in international liquidity that caused the trade crunch, US trade fell by two-thirds. The situation dramatically worsened for workers, despite Smoot and Hawley’s “promises of prosperity” from higher tariffs. Both lost their seats in the 1932 US Senate elections, which coincided with Democrat Franklin D. Roosevelt’s landslide victory.
There is little reason for optimism. To describe the situation we should imagine a once majestic, broken, and bankrupt cruiseship, sailing in the dark night on a still ocean, slowly approaching the Bermuda Triangle. Huge, powerful rogue waves, which can lead to the sinking of the cruiseship, are nearing without warning, making it impossible for the ship’s crew to react. Meanwhile, in the ballroom at CDeck, the Jazz Age lives on; dinner and cocktails are served to an immaculately dressed attendance, all eyes set on music and dance.
Monetization of debt will somehow continue. Rate cuts may return. Debt levels go up, and further up. The more debt is added, the more unproductive and explosive the debt becomes. This time there is no Chinese stimulus to bail us out. Trade conflicts can deepen and can become wars. It takes hard work to turn the tide, and no victory over rising debt, inflation, or trade conflicts, should be declared until the evidence is overwhelming.
@ Brun Lubert Corporation – All Rights Reserved
DISCLAIMER: The information and material presented herein are provided for information purposes only and should under no circumstance be U. S. ed or construed as a solicitation or offering to acquire, dispose, or engage in any financial dealing, including but not limited to the buying or subscribing for securities, investment products, or other financial instruments, nor to constitute any advise or recommendation with respect to such securities, investment products, or other financial instruments. This Bulletin is prepared for general circulation and has no regard to any class of investor or the specific investment objectives or particular needs of any specific person which may receive this Bulletin. Readers should independently evaluate the information and material contained herein before making any investment or other decision, and should take appropriate independent financial advice before making any investments or entering into any transaction in relation to any content mentioned in this Bulletin. It is a violation of U. S. federal and international copyright laws to reproduce all or part of this publication by email, facsimile or any other means. This document is not for attribution in any publication, and you should not disseminate, distribute, or copy this Bulletin, either in whole or in part, without the prior written consent of Brun Lubert Corporation.
Publisher – BRUN LUBERT CORPORATION
Enquiries – BRUN LUBERT CORPORATION
667 Madison Avenue
New York NY 10065
United States
Editor – Ana Beysoylu
Tel. +1 212 823 6246
E. media@brunlubert.com
brunlubert.com
